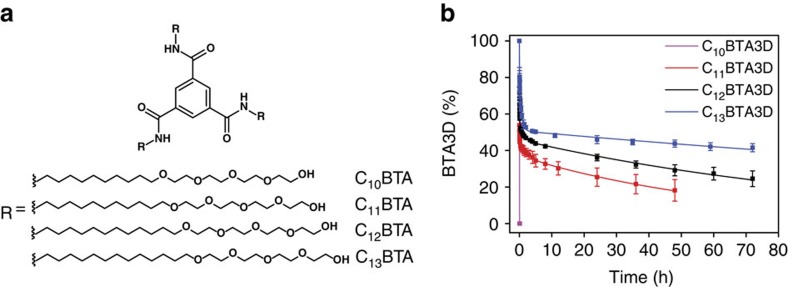
Figure 5. Structure-dependent exchange kinetics.
(a) Molecular structure of C10BTA, C11BTA, C12BTA and C13BTA. (b) Corresponding percentages of BTA3D as a function of time after the dilution of the 500 μM BTA solutions 100 times into D2O. Lines are tri-exponential fits of the data, and the error bars represent one s.d. of uncertainty computed from three separate kinetic experiments.

