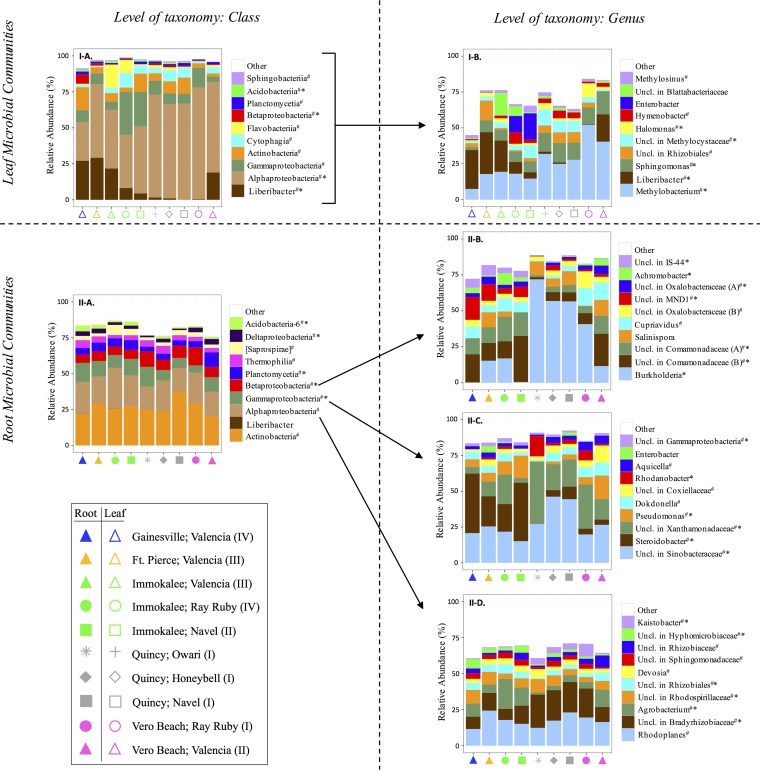
FIG 4.
Relative abundances of dominant taxa assigned to 16S sequences detected in leaves (I) and roots (II) of the citrus trees sampled in fall 2015. (A) Classes, with Liberibacter spp. separate from other Alphaproteobacteria; (B to D) genera. Symbols correspond to tree location (color) and cultivar (shape). The category for HLB symptom severity (I, asymptomatic; II, symptomatic—mild; III, symptomatic—moderate; IV, symptomatic—severe) is indicated. # indicates a member of core microbiota, and * indicates significant difference, with a statistical power of >0.9, from Student's t test for differences in relative abundance in asymptomatic trees (category I) and HLB-symptomatic trees (categories II to IV) (α set at 0.05). Uncl., unclassified.

