
FIG 1.
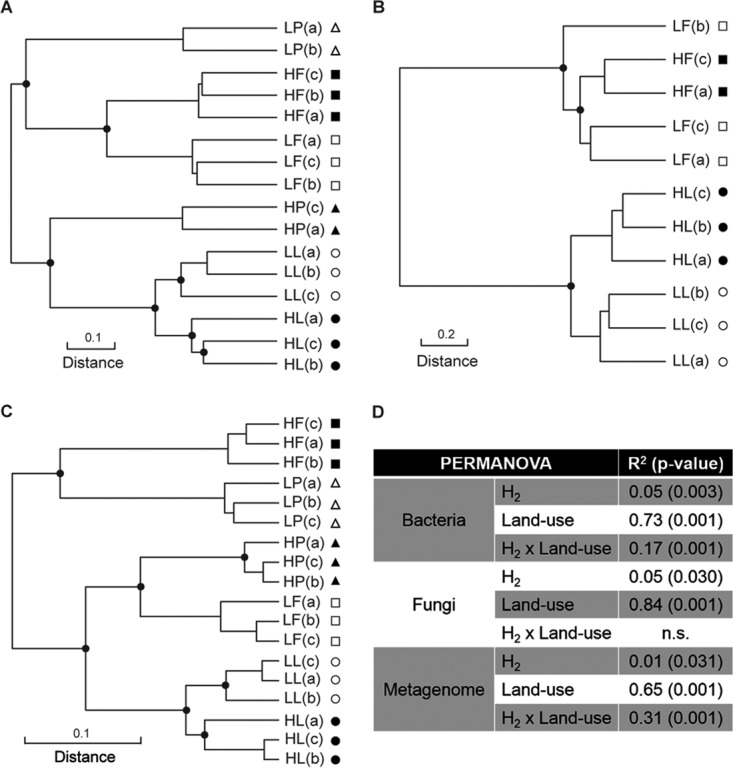
UPGMA agglomerative clustering of soil microcosms according to a Euclidean distance matrix calculated with Hellinger-transformed bacterial (A) and fungal (B) ribotyping profiles and a Bray-Curtis distance matrix of genome bin profiles (C). (D) PERMANOVA displaying the proportion of total β diversity variance explained by soil land use type and H2 treatment. Land use types are represented by the following symbols: squares, farmland; circles, larch; triangles, poplar. Black symbols indicate soil microcosms exposed to eH2 treatment, and white symbols indicate soil microcosms exposed to aH2 treatment. 16S rRNA gene PCR amplicon sequencing failures for samples LP(c) and HP(b) and ITS2 PCR amplicon sequencing failures for six poplar samples and HF(b) impaired their inclusion in the analysis. The term n.s. represents nonsignificant relationships.