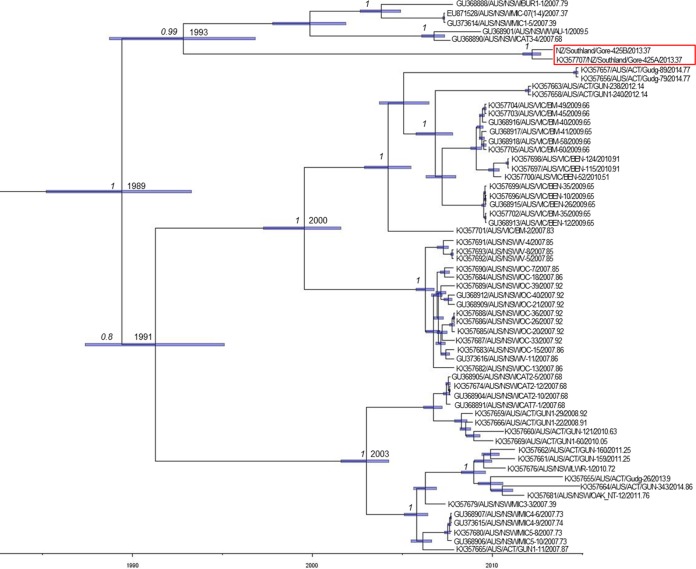
FIG 4.
Bayesian Markov chain Monte Carlo tree of RCV-A1 sequences and New Zealand RCV-A1 isolates. The x axis provides a time scale (years). Mean TMRCA values are shown at each node, and node bars (purple) depict 95% HPD values on node height (age). Posterior probability values, a measure of support, are shown at key nodes when >0.8. The year of sampling is represented in decimal form at the end of the taxa name. The GenBank accession numbers of published sequences included in the tree are indicated at the beginning of the taxon name. The red box represents the isolates used in this study (Gore-425A and Gore-425B).

