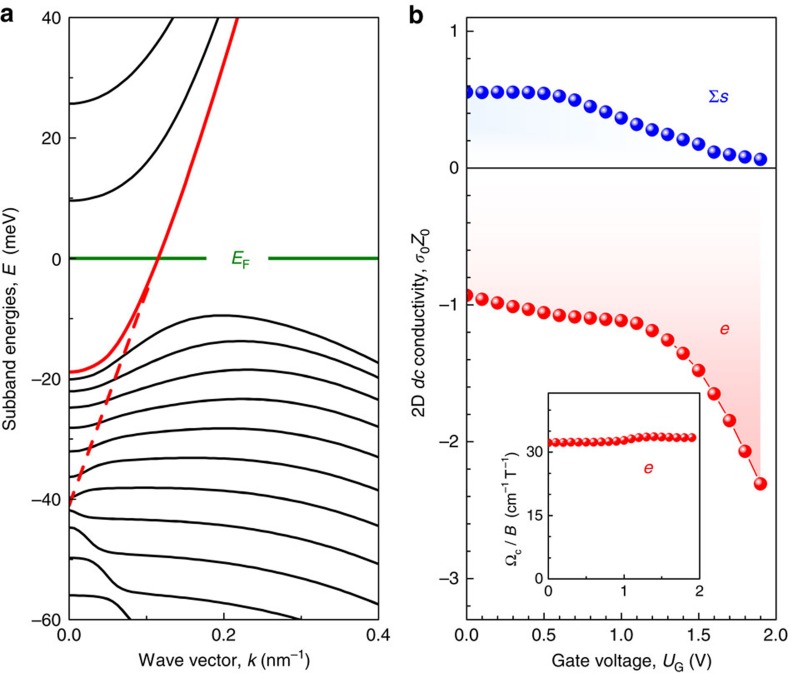
Figure 2. Charge carriers in strained HgTe.
(a) The band structure of the Cd0.7Hg0.3Te/HgTe heterostructure close to the Γ-point for UG=1.9 V. The chemical potential (green line) crosses the Dirac-like surface state (red solid line) in the band gap corresponding to the electron CR Ωce. The dashed red line shows the linear dispersion of the 2D surface state without hybridization with the heavy-hole band. (b) 2D dc conductivity σ0 of different charge carriers (e and Σs=s1+s2), obtained by Drude-like fits to equations (2) and (3) of the magnetooptical spectra. The dimensionless values are given relative to the impedance of free space  . The inset shows the e-CR in terms of Ωce/B as a function of the gate voltage UG.

