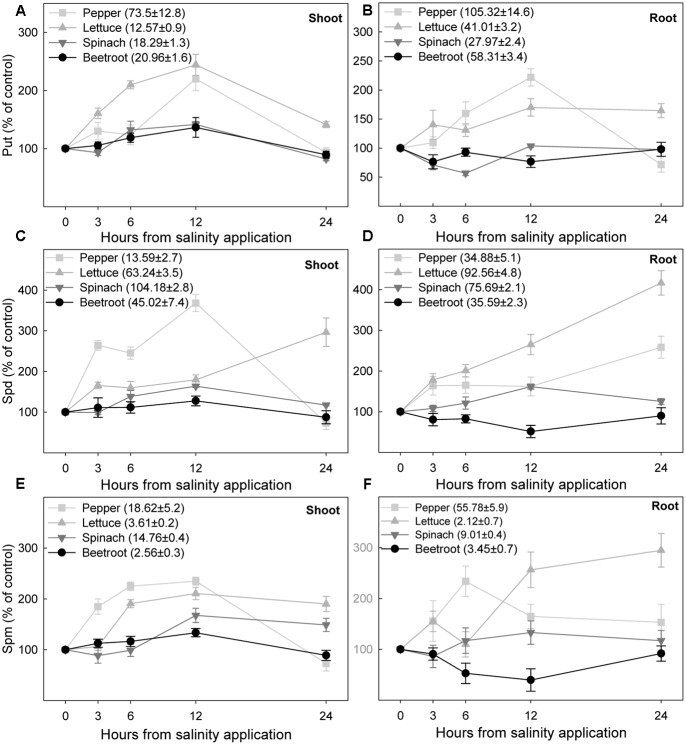
FIGURE 8.
Changes in putrescine, spermidine, and spermine under saline stress (expressed as percentage with respect to controls) in shoot (A,C,E) and root (B,D,F) of the different plant species, after saline shock application. Data are the mean ± SE of determinations made independently in four replicates of three plants. Data in brackets are the value of each polyamine before the application of saline shock.

