
Fig. 5.
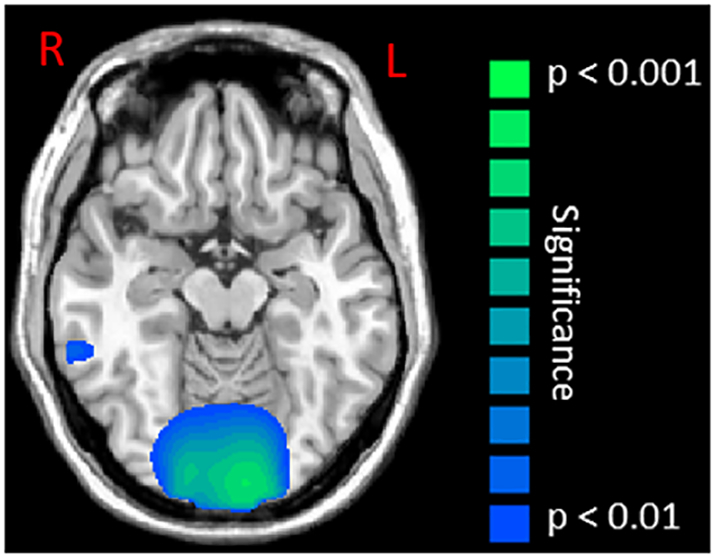
Statistical parametric maps (SPMs) of the group effect for beta oscillatory activity (16–24 Hz) in the occipital cortices during the motor execution stage (0 to 0.5 s). This image has been thresholded at (P < 0.01, corrected) and is displayed following the radiological convention (R = L). As shown, children with cerebral palsy had a weaker beta event-related desynchronization relative to typically developing children within the occipital cortices and visual MT area.