
Figure 1.
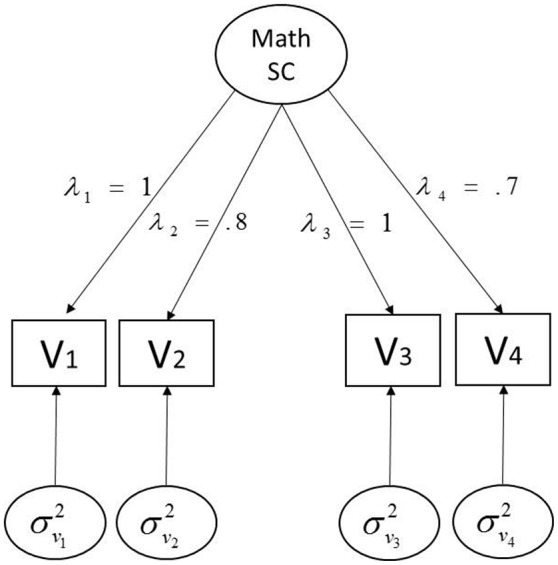
Population model for simulation. λs represent the factor loadings [1, 0.8, 1, 0.7] for V1–V4; σ2s denote the residual variances for V1–V4, and thresholds τs are [0, 2, 3] for V1, [0, 1, 1.5] for V2, and [0, 1, 2] for V3 and V4, respectively.