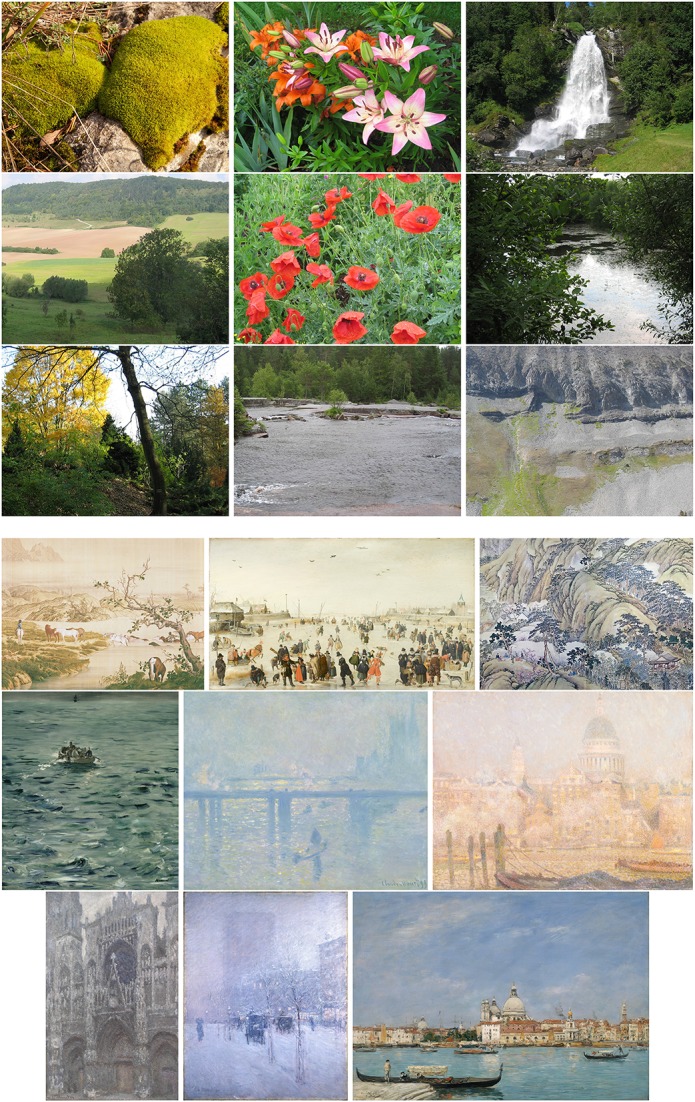
Figure 9.

The most strongly misclassified images, based on their distance to the decision boundary of the SVM classifier. The top half of the figure shows non-art images misclassified as artworks, the bottom half shows artworks misclassified as non-art images. The Pa(22) and Pf(12) values of each image are listed in Table 2.
