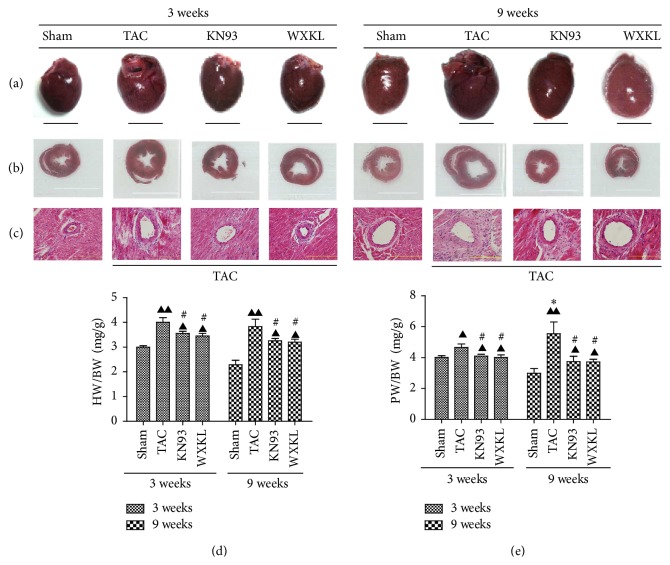
Figure 1.
(a) Representative images of hearts from the Sham (n = 5), TAC (n = 5), KN93 (n = 5), and WXKL (n = 5) groups at 3 and 9 weeks after treatment. Scale: 1 cm. (b) Representative images of the largest cross-section of the heart from each group at 3 and 9 weeks (n = 5). (c) Representative images of left ventricular apical biopsy of each group at 3 and 9 weeks (H&E staining at 400x magnification; n = 5). (d) Ratios of heart weight to body weight (HW/BW) are shown (n = 5). (e) Ratios of pulmonary weight to body weight (PW/BW) are shown at 3 and 9 weeks. (n = 5). ▲P < 0.05 and ▲▲P < 0.01 versus the Sham group. #P < 0.05 versus the TAC group. ∗P < 0.05 versus the TAC group at 3 weeks.

