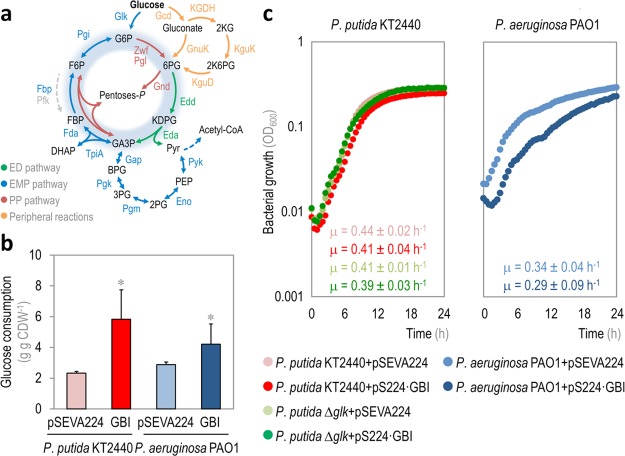
Figure 3.
Characterization of physiological parameters in recombinant Pseudomonas putida and P. aeruginosa strains carrying Module I. (a) Schematic representation of central carbon metabolism in Pseudomonas species. Glucose catabolism occurs mainly through the activity of the Entner–Doudoroff (ED) pathway, but part of the trioses-P thereby generated are recycled back to hexoses-P by means of the EDEMP cycle, that also encompasses activities from the Embden–Meyerhof–Parnas (EMP) and the pentose phosphate (PP) pathways. Note that a set of peripheral reactions can also oxidize glucose to gluconate and/or 2-ketogluconate (2KG) before any phosphorylation of the intermediates occurs. Each metabolic block is indicated with a different color along with the relevant enzymes catalyzing each step, and the EDEMP cycle is shaded in blue in this diagram. Note that the 6-phosphofructo-1-kinase activity, missing in most Pseudomonas species, is highlighted with a dashed gray arrow. The abbreviations used for the metabolic intermediates are as indicated in the legend to Figure 1; other abbreviations are as follows: 6PG, 6-phosphogluconate; KDPG, 2-keto-3-deoxy-6-phosphogluconate; acetyl-CoA, acetyl-coenzyme A; 2KG, 2-ketogluconate; and 2K6PG, 2-keto-6-phosphogluconate. (b) Glucose consumption profile and (c) growth curves of P. putida KT2440, its Δglk derivative, and P. aeruginosa PAO1, carrying either the control vector (pSEVA224) or pS224·GBI (Module I). Glucose consumption is reported as the mean value ± standard deviation from duplicate measurements in at least three independent experiments. CDW, cell dry weight. Significant differences (P < 0.05, as evaluated by means of the Student’s t test) in the pairwise comparison of a given recombinant to the control strain, carrying the empty pSEVA224 vector, are indicated by an asterisk. In the growth curves, each data point represents the mean value of the optical density measured at 600 nm (OD600) of quadruplicate measurements from at least three independent experiments. The specific growth rates were calculated from these data during exponential growth, and the inset shows the mean values ± standard deviations for each strain.

