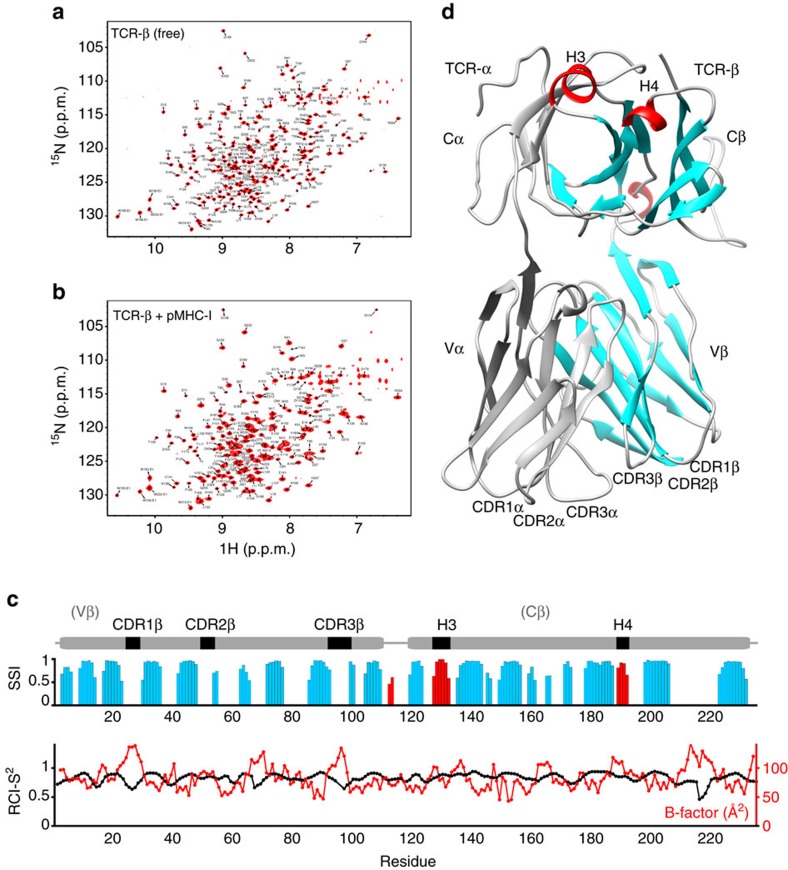
Figure 3. NMR characterization of a TCR and its pMHC complex.
(a) amide 2D 1H-15N TROSY-HSQC (900 MHz 1H field strength) of a 47.6 kDa disulfide-linked B4.2.3 TCR-αβ heterodimer that is 15N,13C,2H-labelled at the β-chain with 100% back exchanged protons at the amide positions during in vitro refolding. The α-chain of the molecule is unlabelled. (b) Spectra of the 94.7 kDa 1:1 high-affinity complex of B4.2.3 TCR with P18-I10/H2-Dd/β2m (KD∼0.5 μM). To improve signal-to-noise for the larger complex, a 16-fold increased number of scans was used when acquiring the data. (c) TALOS-N secondary structure index (SSI) derived from the combined 1H, 15N and 13C chemical shifts along the TCR β-chain sequence. Blue bars of increasing height indicate regions with high β-sheet propensity based on chemical shifts, while red bars correspond to regions with a strong α-helical signature. Gaps correspond to predicted loop regions. The random coil index order parameter (RCI-S2) is also shown, with values <0.75 further indicating unstructured coil regions in solution. As a comparison, the crystallographic B-factors of amide N atoms in the X-ray structure of the free TCR β-chain are also shown in red. The domain diagram of the β-chain is shown on the top of the plot as guide. (d) X-ray structure of the disulfide-linked TCR-αβ heterodimer in the free form, showing the unlabelled α-chain (grey) and labelled β-chain, highlighting the CDRs in the Vα, Vβ domains and short helical regions in the Cβ domain (H3, H4). The TALOS-N-derived secondary structure based on the NMR chemical shifts is also shown on the structure with same colours as in c and grey for loops, with cartoons drawn according to the DSSP annotation of the PDB entry. CDR, complementarity-determining regions. H3, H4 Cβ domain α-helices 3 and 4.

