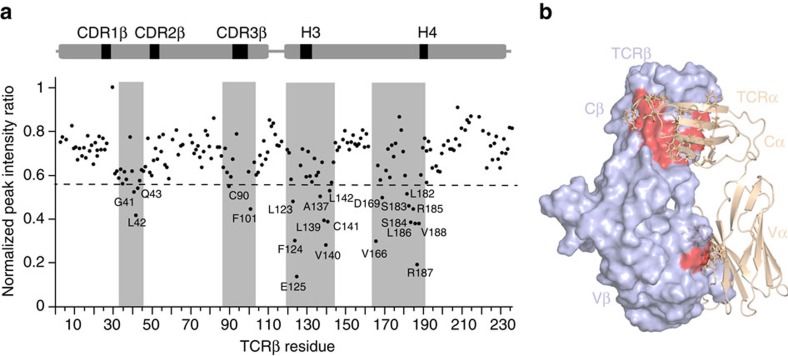
Figure 4. Cross-saturation transfer NMR elucidates intermolecular contacts of the αβ-TCR in solution.
(a) Cross-saturation transfer experiment performed on free U-[15N, 2H] β-chain-labelled and unlabelled (protonated) α-chain B4.2.3 TCR acquired at 800 MHz, 25 °C. Experimental details are outlined in Methods. The plot shows the normalized peak intensity ratio (Isaturated/Inon-saturated) as a function of TCRβ residue. The dashed line signifies 1 s.d. of chemical shift change from the average. (b) Mapping of TCRβ residues affected upon cross-saturation transfer (shown in red) on the X-ray structure of the B4.2.3 TCR with β-chain shown as a surface display (light blue) and α-chain shown as cartoon (wheat) with side chains of α-chain residues near the α/β interface shown as sticks.

