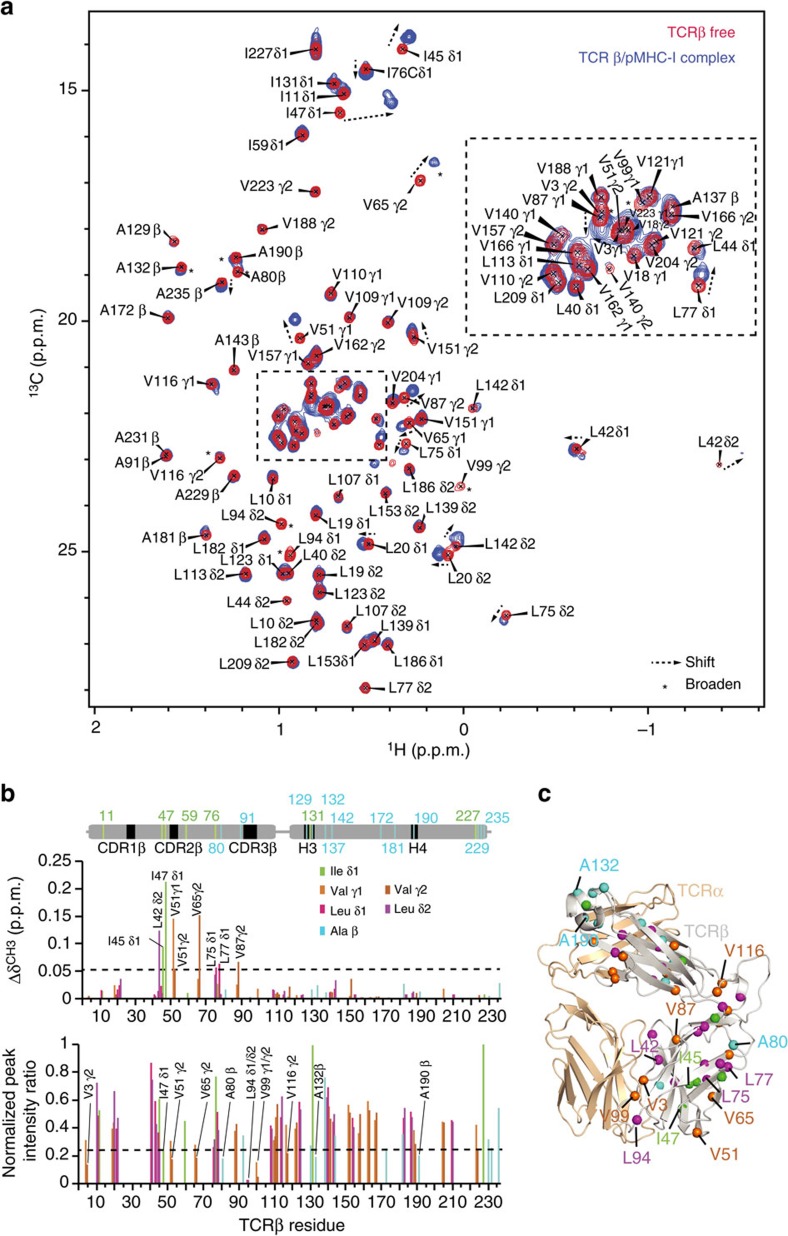
Figure 6. Methyl probes of TCR and pMHC complex formation.
(a) 2D 1H-13C HMQC spectra of AILV 13C-methyl labelled U-[15N, 2H] β-chain β4.2.3 TCR in the free (red) and 1:1 P18-I10/H2-Dd bound (blue) states acquired at 800 MHz, 25 °C. Changes in chemical shift position are indicated with arrows, while changes in chemical shift intensity due to line broadening are indicated by asterisks. Stereo-specific chemical shift assignments are indicated. Assignment of AILV-methyl chemical shifts is outlined in Supplementary Figs 2–5. (b) Plot of chemical shift deviation (CSD in p.p.m.; top) and normalized peak intensity ratio (Ibound/Ifree; bottom) as a function of TCRβ methyl residue number. The dashed line signifies 1 s.d. of combined chemical shift change from the average. Affected residues are indicated. (c) Mapping of Ala, Ile, Leu and Val methyl probes on the X-ray structure of B4.2.3 TCR with α-chain coloured wheat and β-chain coloured grey. Residues that are affected in either CSD or intensity ratio between the free and bound states are indicated.

