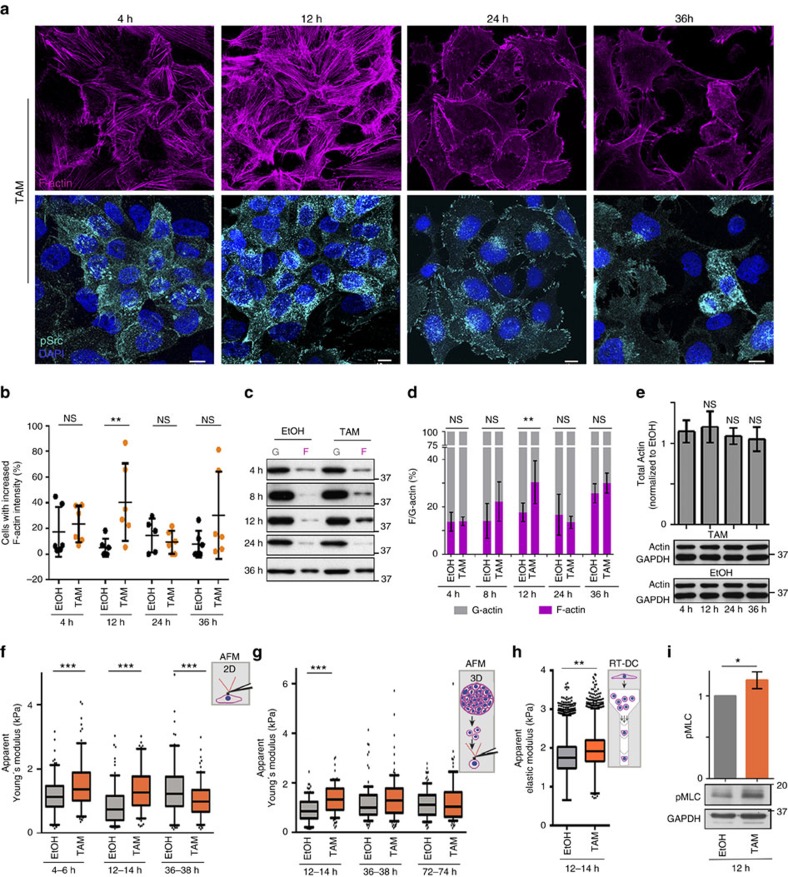
Figure 2. Transient F-actin accumulation and cell stiffening by Src activation.
(a) Standard confocal sections of ER-Src cells treated with TAM for 4, 12, 24 or 36 h, stained with Phalloidin (magenta) to mark F-actin, anti-p-Src (cyan) and DAPI (blue). Scale bars, 10 μm. (b) Percentage of ER-Src cells with high F-actin levels, treated with EtOH (black dots) or TAM (orange dots) for 4, 12, 24 or 36 h. Each dot represents one technical replicate from two biological replicates. Horizontal line indicates median values. (c) Western blot on protein extracts from ER-Src cells treated with EtOH or TAM for 4, 8, 12, 24 or 36 h, blotted with anti-actin. (d) Quantification from three biological replicates of the G- (grey) and F-actin (magenta) ratio in EtOH- or TAM-treated ER-Src cells for the time points indicated. (e) Western blots on protein extracts from ER-Src cells treated with EtOH or TAM for 4, 12, 24 or 36 h, blotted with anti-actin and anti-GAPDH, and quantification from three biological replicates of the ratio of total actin levels between TAM- and EtOH-treated ER-Src cells for the same time points, normalized to GAPDH for the corresponding lanes on western blots. (f–h) Apparent Young's moduli of ER-Src cells, treated with EtOH (grey bars) or TAM (orange bars) for the time points indicated, measured by (f,g) AFM in f 2D or (g) 3D, or by (h) RT-DC. Data are from three (f) or two (g,h) biological replicates and are presented as boxplots (25th, 50th, 75th percentiles) and whiskers indicating 10th and 90th percentiles. (i) Western blots on protein extracts from ER-Src cells treated with EtOH or TAM for 12 h, blotted with anti-pMLC or anti-GAPDH, and quantification from three biological replicates of pMLC levels, normalized to GAPDH for the corresponding lane on western blots. EtOH treatment (grey bar), TAM treatment (orange bar). Error bars indicate s.d.; NS indicates non-significant; *P<0.05; **P<0.001; ***P<0.0001. Statistical significance was calculated using (b–e) one-way ANOVA or (f,g) simple Mann–Whitney or (h) linear mixed models or (i) impaired t-test. See also Supplementary Fig. 1.

