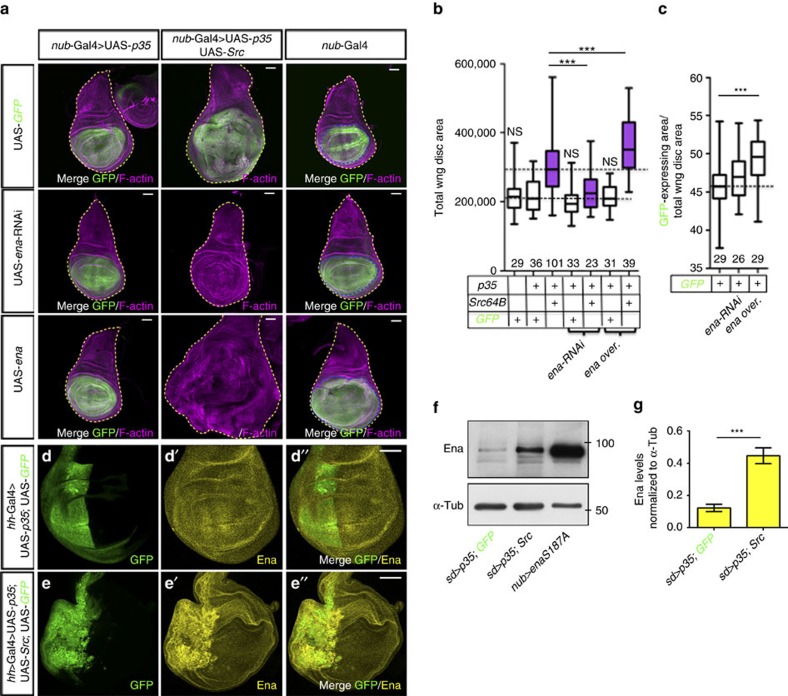
Figure 4. Drosophila EVL/Ena promotes Src-induced tissue overgrowth.
(a) Standard confocal sections of third instar wing imaginal discs with dorsal side up, stained with Phalloidin (magenta). (Left column) nub-Gal4; UAS-p35 or (middle column) nub-Gal4, UAS-p35, Src64BUY1332 or (right column) nub-Gal4 and carrying (first row) UAS-mCD8-GFP (green) or (second row) UAS-ena-RNAi or (third row) UAS-ena. The yellow dashed lines outline the whole wing disc area. The blue lines outline the Nub>GFP-expressing domains. The scale bars represent 30 μm. (b,c) Total wing disc area (b) or ratio of the Nub>GFP area over the total wing disc area (c) for the genotypes indicated. Numbers of samples indicated on the X axis are from two biological replicates. NS, indicates non-significant for comparison with Nub>GFP,p35. Error bars indicate s.d. ***P<0.0001. (d–d″ and e–e″) Standard confocal sections of third instar wing imaginal discs stained with anti-Ena (yellow), carrying hh-Gal4 and (d–d″) UAS-p35 and UAS-mCD8-GFP (green) or (e–e″) UAS-p35 and Src64BUY1332 and UAS-mCD8-GFP (green). Dorsal side is up and posterior is to the left. Scale bars represent 30 μm. (f) Western blots on protein extracts from wing imaginal discs expressing UAS-mCD8-GFP and UAS-p35 (lane 1) or UAS-p35 and Src64BUY1332 (lane 2) and sd-Gal4 or UAS-enaS187A and nub-Gal4 (lane 3), blotted with anti-Ena and anti-α-Tubulin (α-Tub). (g) Quantification from three biological replicates of the ratio of Ena levels normalized to α-Tub for the genotypes indicated. Error bars indicate s.d. ***P<0.0005. Statistical significance was calculated using the impaired t-test. See also Supplementary Fig. 5 and Supplementary Table 2.

