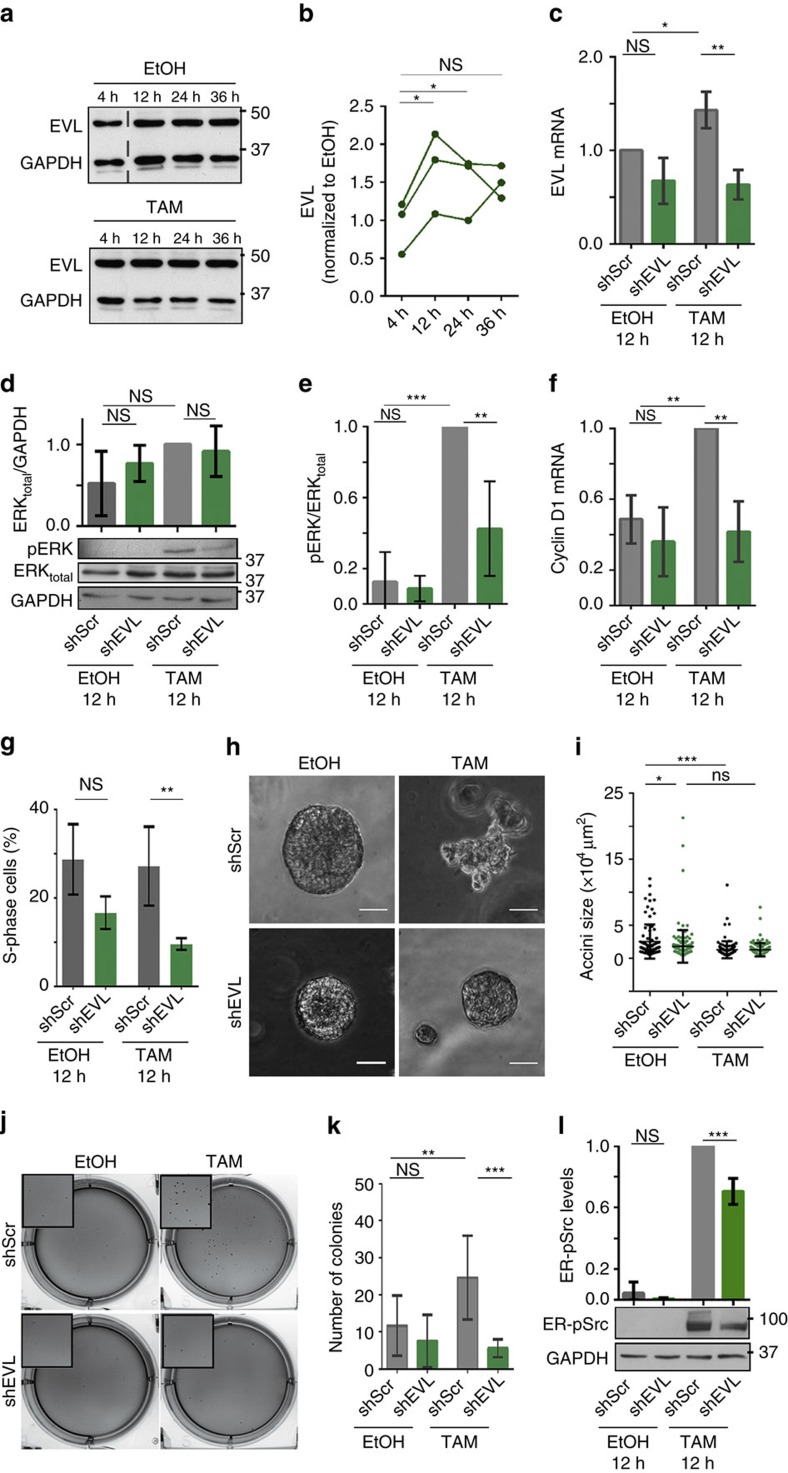
Figure 5. EVL sustains Src-induced proliferation via ERK activation.
(a) Western blots on protein extracts from ER-Src cells treated with EtOH or TAM for 4, 12, 24 or 36 h, blotted with anti-EVL and anti-GAPDH (see original blot in Supplementary Fig. 6A). (b) Ratio of EVL levels between TAM- and EtOH-treated ER-Src cells for the same time points, normalized to GAPDH. (c) EVL mRNA levels on extracts from ER-Src cells expressing shScr or shEVL#2 and treated with EtOH or TAM for 12 h. (d) Western blots on protein extracts from ER-Src cells expressing shScr or shEVL#2 and treated with EtOH or TAM for 12 h, blotted with anti-pERK or anti-ERK or anti-GAPDH, and quantification of total ERK levels between EtOH- and TAM-treated cells, normalized to GAPDH for the corresponding lanes on western blots. (e) Ratio of pERK over total ERK levels, normalized to GAPDH for the experimental conditions indicated. (f,g) Cyclin D1 mRNA levels (f) or number of cells in S-phase (g) for ER-Src cells expressing shScr or shEVL#2 and treated with EtOH or TAM for 12 h. (h) 14-day cultures on Matrigel of EtOH- or TAM-treated ER-Src acini, expressing shScr or shEVL#2. Scale bars represent 50 μm. (i) Quantification from two biological replicates of acini size for the experimental conditions indicated. Horizontal lines indicate median values. (j) Phase-contrast images of ER-Src colonies grown in soft agar without EGF, expressing shScr or shEVL#2 and treated with EtOH or TAM. Inset images correspond to a 135% magnification. (k) Number of colonies for the experimental conditions indicated. (l) Western blots on protein extracts from ER-Src cells expressing shScr or shEVL#2 and treated with EtOH or TAM for 12 h, blotted with anti-pSrc to reveal ER-pSrc or anti-GAPDH, and quantifications of ER-pSrc levels, normalized to GAPDH for the corresponding lanes on western blots. shScr treatments (grey bars), shEVL treatments (green bars). Quantifications are from three biological replicates, unless indicated. Error bars indicate s.d.; NS indicates non-significant; *P<0.05; **P<0.001; ***P<0.0001. Statistical significance was calculated using (b) a Friedman or (c–l) one-way ANOVA tests. See also Supplementary Fig. 6.

