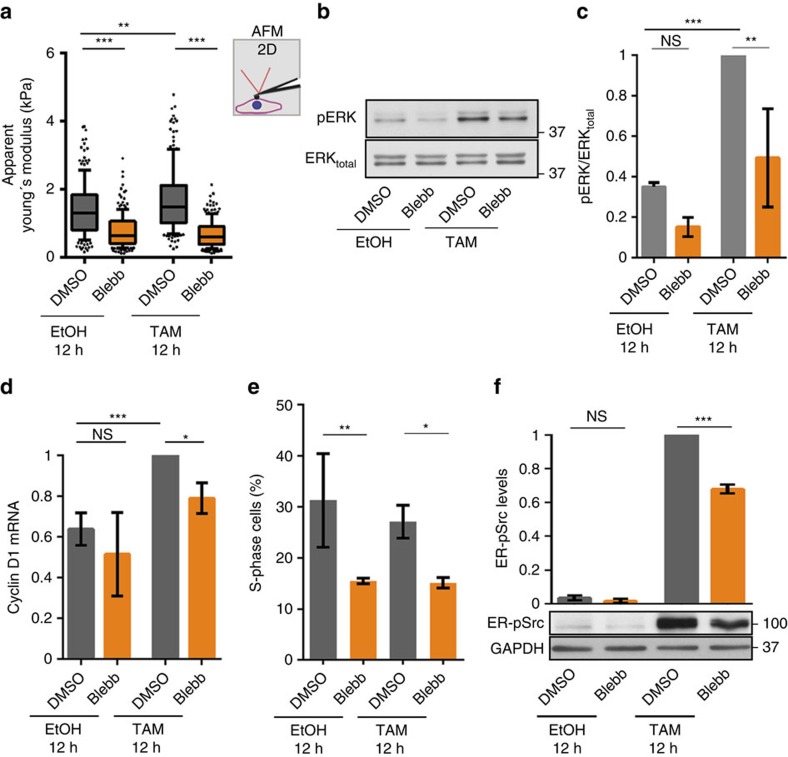
Figure 7. Myosin potentiates ERK and ER-Src activities downstream of Src.
(a) Apparent Young's moduli of ER-Src cells cultured in 2D, treated with EtOH or TAM and DMSO (grey bars) or Blebbistatin (orange bars) for 12 h. Data are presented as boxplots (25th, 50th, 75th percentiles), and whiskers indicate the 10th and 90th percentiles. (b) Western blots on protein extracts from ER-Src cells treated with EtOH or TAM and DMSO or Blebbistatin for 12 h, blotted with anti-pERK or anti-ERK. (c) Ratio of pERK over total ERK levels, normalized to GAPDH in ER-Src cells treated with EtOH or TAM and DMSO (grey bars) or Blebbistatin (orange bars) for 12 h. (d) Cyclin D1 mRNA levels on protein extracts from ER-Src cells treated with EtOH or TAM and DMSO (grey bars) or Blebbistatin (orange bars) for 12 h. (e) Number of ER-Src cells in S-phase treated with EtOH or TAM and DMSO (grey bars) or Blebbistatin (orange bars) for 12 h. (f) Western blots on protein extracts from ER-Src cells treated with EtOH or TAM and DMSO or Blebbistatin for 12 h, blotted with anti-pSrc to reveal ER-pSrc or anti-GAPDH, and quantification of ER-pSrc levels, normalized to GAPDH for the corresponding lanes on western blots. All quantifications are from three biological replicates. Error bars indicate s.d.; NS indicates non-significant; *P<0.05; **P<0.001; ***P<0.0001. Statistical significance was calculated using (a) simple Mann–Whitney or (c–f) one-way ANOVA tests.

