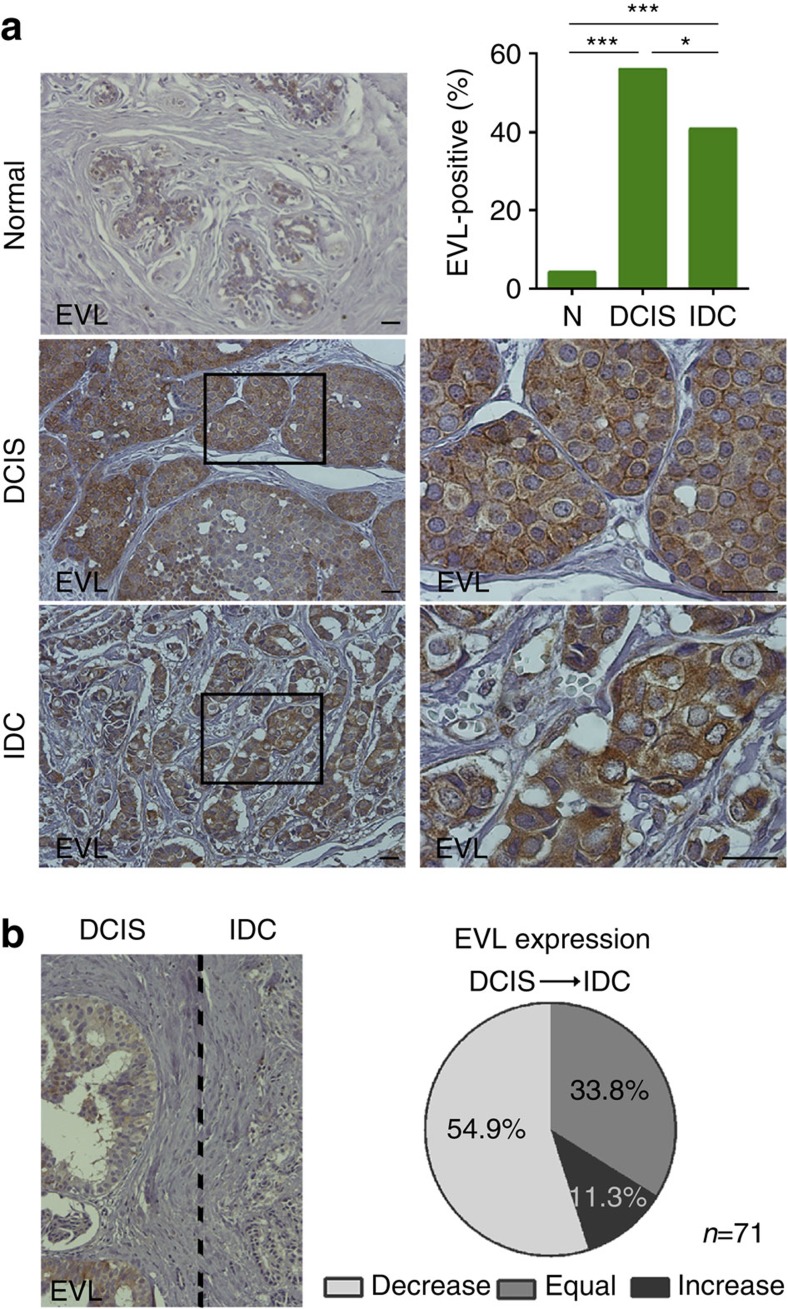
Figure 8. EVL predominantly accumulates in DCIS.
(a) Representative images of EVL staining by IHC in normal breast tissues, DCIS and IDC, and quantification of EVL protein expression at each stage. *P=0.023; ***P<0.0001. Statistical significance was calculated using Fisher's exact test. Values are from visual scores±s.e.m. Scale bars represent 100 μm. Images on the right are magnifications of the boxed areas. (b) Representative image of EVL staining by IHC from the same breast carcinoma sample containing both an in situ and an invasive component and quantification (71 cases). Scale bar represents 100 μm.

