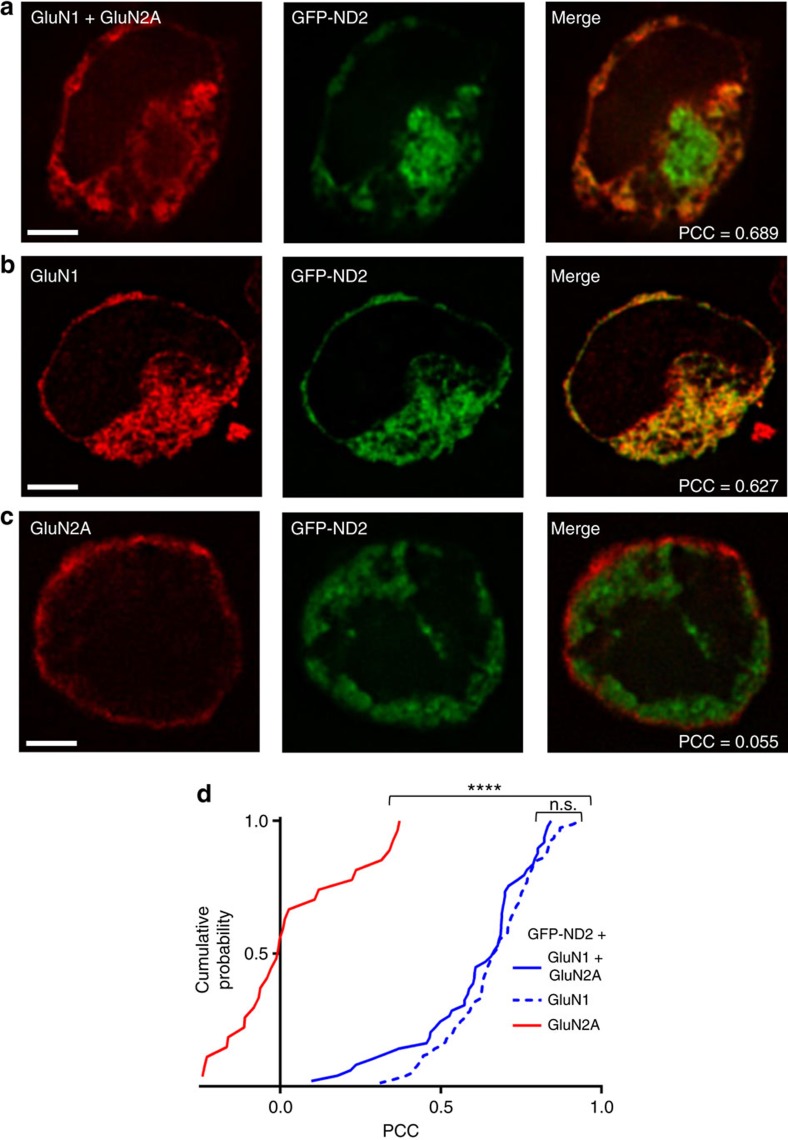
Figure 3. GFP-tagged ND2 co-localizes with GluN1 but not GluN2A.
Representative images of HEK293 cells expressing GFP-tagged ND2 with GluN1+GluN2A (a), GluN1 alone (b) or GluN2A alone (c). (d) Cumulative frequency distribution of thresholded PCC values for GFP-ND2 with GluN1+GluN2A, (mean PCC=0.61±0.03; n=49), GluN1 alone, (0.67±0.02; n=78) and GluN2A alone (0.03±0.04; n=28). Scale bar, 3 μm. Statistically significant differences between populations are indicated by the symbol ‘****'(P<0.0001), and were evaluated by Kruskal–Wallis non-parametric analysis of variance with Dunn's multiple post hoc comparison tests. n=# of cells. Results are presented as mean±s.e.m. See also Supplementary Fig. 3.

