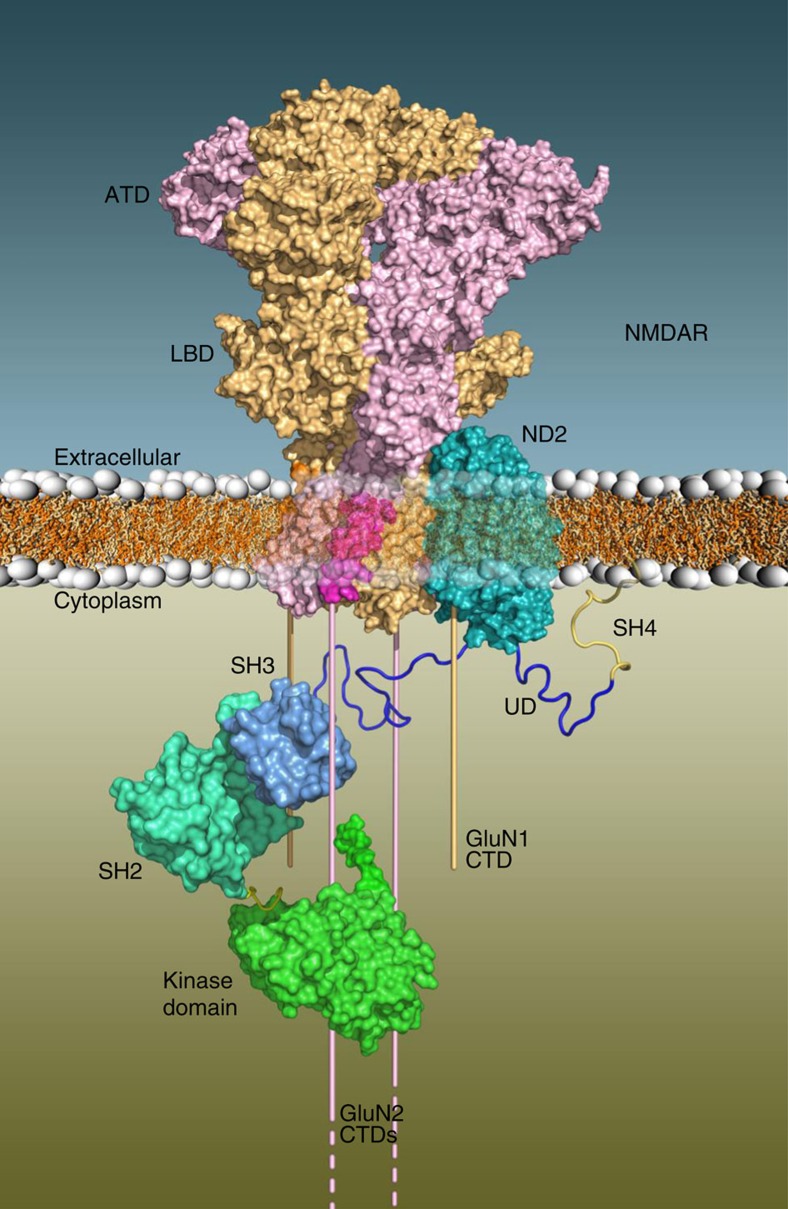
Figure 7. Schematic diagram of the ND2–NMDAR complex anchoring Src near the CTDs of GluN2.
Surface representations of the ND2–NMDAR complex in the membrane with the CTDs of GluN1 (light orange) and GluN2 (light purple) shown as bars emerging from the TMD of NMDAR. Src catalytic (green surface), SH2 (light blue surface), SH3 (medium blue surface), UD (dark blue ribbon) and SH4 (gold ribbon) domains are shown, suggesting interactions between the Src UD and cytoplasmic loop of ND2 facilitated by the ND2–NMDAR interaction.

