
Figure 3.
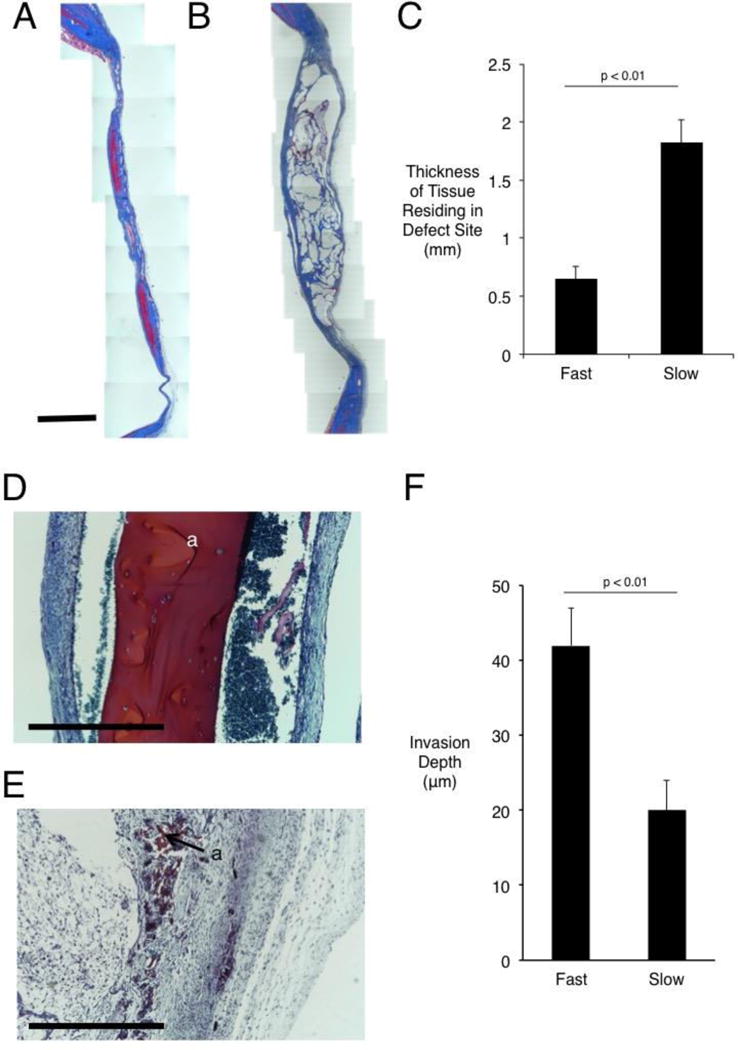
Histological staining and quantification of calvarial wound site remodeling three months post-injury. (A) Masson’s Trichrome staining of defect site in fast-relaxing (A) and slow-relaxing (B) gel conditions. Scale bar – 2mm in A and B. (C) Quantification of thickness of tissue residing in defect site, as determined by measuring tissue sections stained with Masson’s Trichrome at various points along the membrane that were incident with the implant (Student’s t-test, n=8–10). Error bars represent S.D. (D) Safranin O stain of defect site in slow-relaxing (D) and fast-relaxing (E) cases carrying cells after two weeks of implantation. Scale bars – 1mm. Residual alginate stains red and is marked “a.” (F) Quantification of fibroblast infiltration into hydrogels at one week in vitro after seeding on surface of gel (Student’s t-test, n=15 measurement sites). Error bars represent S.D.