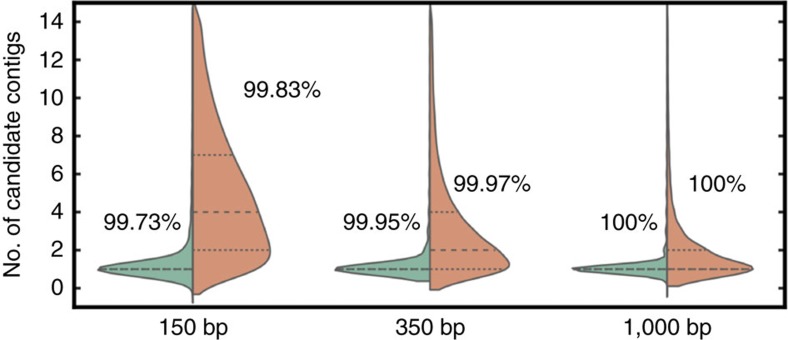
Figure 2. Distribution of the number of candidate contigs (cropped) selected per read from the MHG for varying read lengths.
The data sets used consist of 100 K reads simulated from GRCh37 with wgsim13 using default parameters and a sequencing error rate of 1%. The percentage of reads for which the true contig (that is, the contig covering the true alignment position) was selected is shown on top of each distribution. For each read length, two distributions are shown according to the setting of the bmin_hits parameter that represents the minimum number of MHG buckets that must contain the contig for it to be selected as a candidate: bmin_hits=1, all contigs in the buckets (orange); bmin_hits=2, contigs present in at least two buckets (green).

