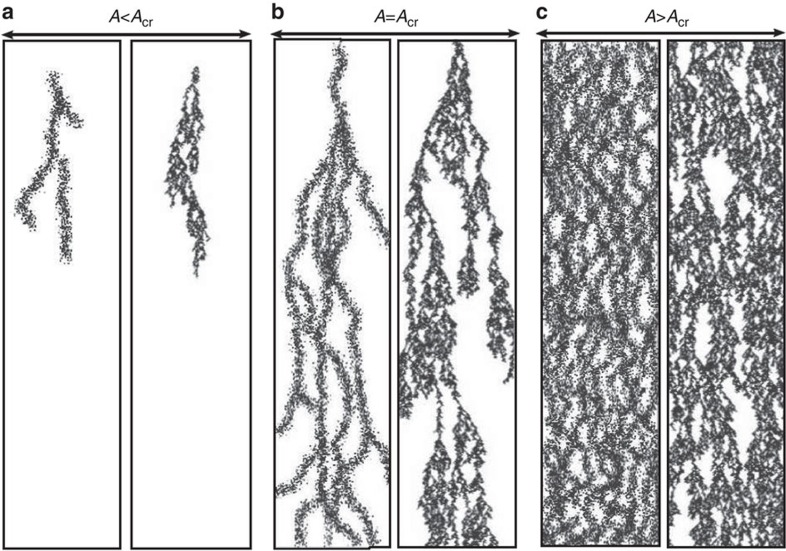
Figure 3. Active turbulence percolates over time as the active puffs split and decay.
Spatiotemporal evolution of active puffs represented by space-time kymograph of the height-averaged enstrophy (a) below the critical activity A<Acr, (b) at the critical activity A=Acr and (c) above the critical activity A>Acr. In a–c, left panels correspond to active turbulence and right panels show simulations from the Domany–Kinzel cellular automaton model of directed percolation model with rare spontaneous activations.

