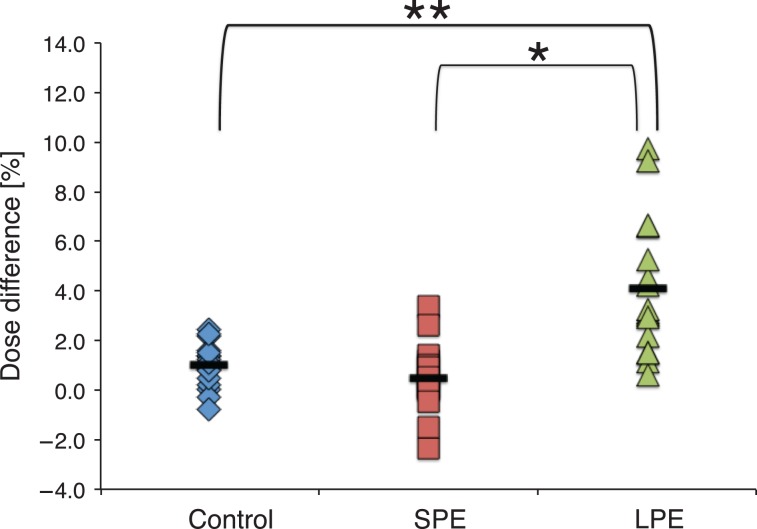
Fig. 4.
Distribution of point dose differences for each group. The vertical axis represents the percentage dose difference between the PinPoint ionization chamber measured doses and the MultiPlan-calculated doses. Solid black bars represent the mean dose differences for each group. *: P < 0.05, **: P < 0.001, SPE: group with smaller potential errors, LPE: group with larger potential errors.

