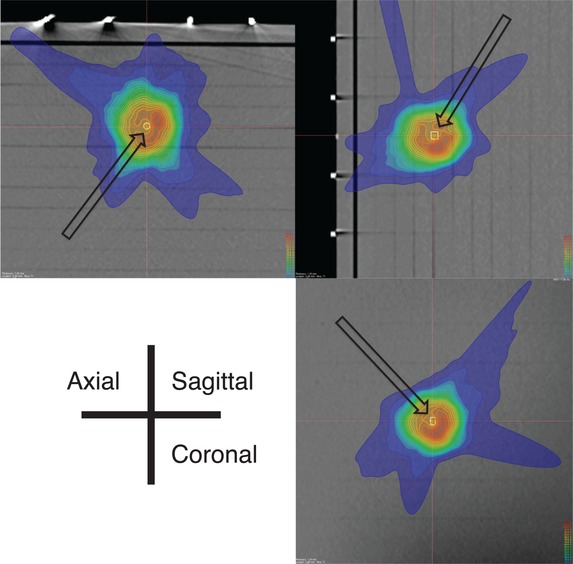
Fig. 7.

Three-dimensional dose distribution in a single case (indicated by a yellow arrow in Fig. 5b). The 100% isodose line was normalized at 7.0 Gy, and the solid white line indicates the PinPoint ionization chamber voxel of interest. The solid orange and yellow lines represent the 90% and 80% isodoses, respectively.
