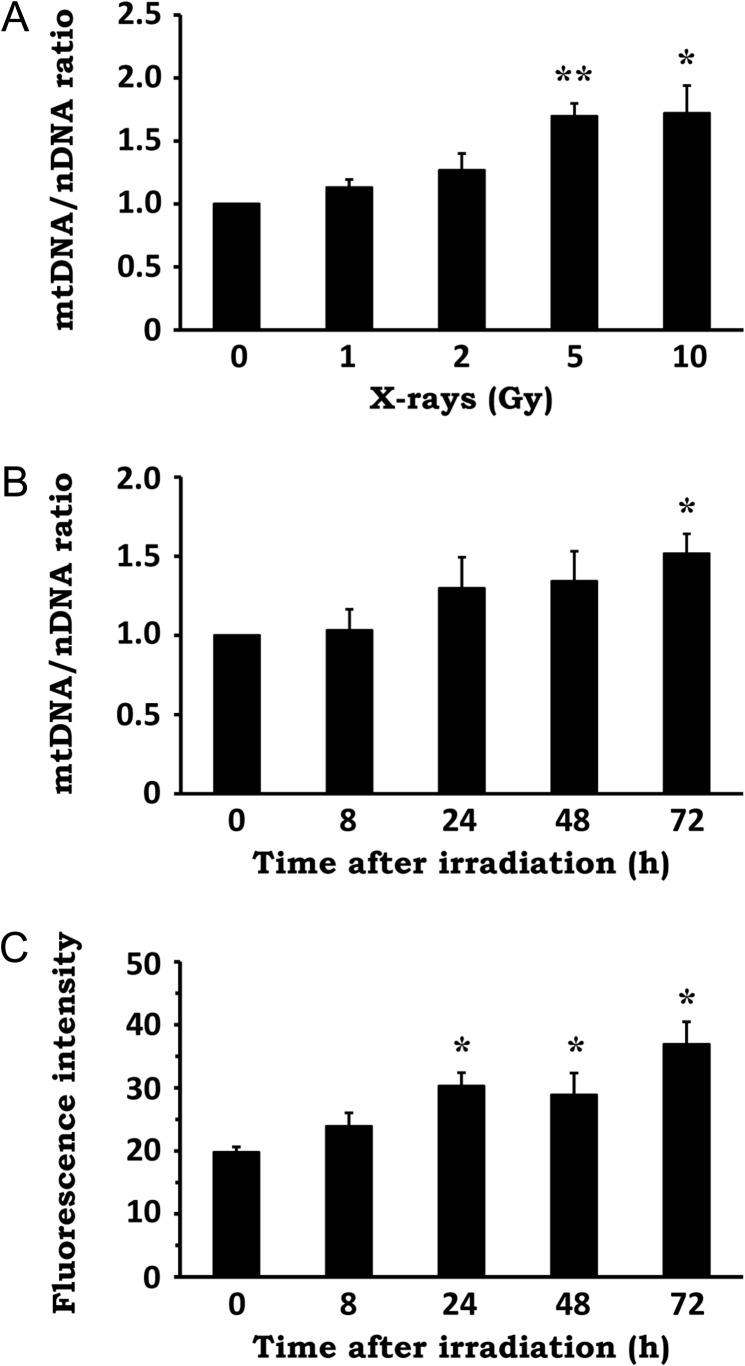
Fig. 1.
Effect of X-irradiation on mitochondrial abundance. (A) NIH/3T3 cells were exposed to X-rays at the indicated doses, followed by a 72-h incubation period. Total genomic DNA was extracted and the mtDNA/nDNA ratio was determined by real-time PCR. (B) NIH/3T3 cells were exposed to 10 Gy X-rays and incubated for the indicated times. Total genomic DNA was extracted and the mtDNA/nDNA ratio was determined by real-time PCR. (C) NIH/3T3 cells were exposed to 10 Gy X-rays and incubated for the indicated times. The cells were stained with MitoTracker Green and fluorescence intensity was evaluated by flow cytometry. Data are expressed as mean ± SD of three independent experiments. *P < 0.05, **P < 0.01 versus 0 Gy or 0 h (Dunnett's test).

