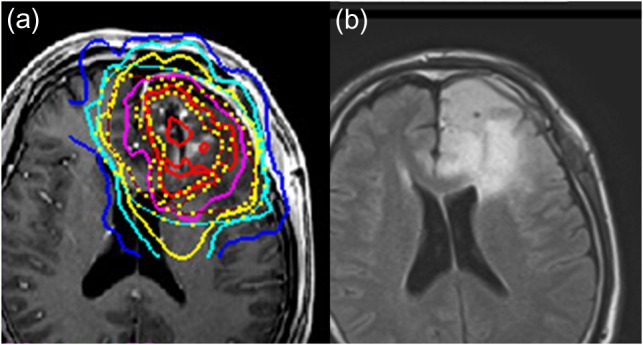
Fig. 2.

A magnetic resonance T1-weighted contrast-enhanced image with isodose lines of the IMRT boosts (a) and fluid-attenuated inversion recovery (FLAIR) image sequences (b) in a patient. The red line represents a dose of 28 Gy/8 fr, daily, 3.5 Gy to the CTV3. The yellow line indicates a dose of 16 Gy/8 fr, daily, 2.0 Gy to the CTV2.
