Fig. 3.

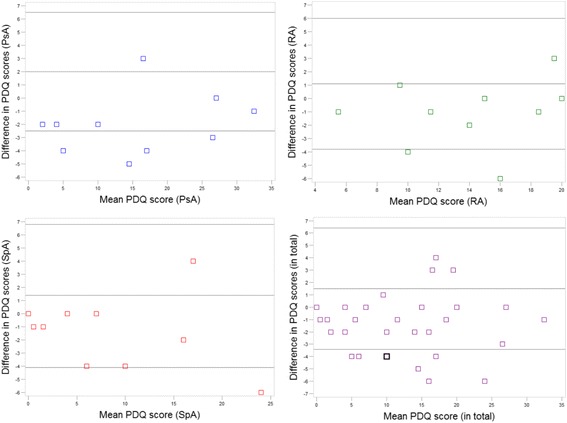
Bland Altman plots showing the agreement of PDQ scores between test and retest. ‘In total’ refers to the total of all scores across diagnoses. The square in bold in the diagram showing ‘in total’ represents two patients

Bland Altman plots showing the agreement of PDQ scores between test and retest. ‘In total’ refers to the total of all scores across diagnoses. The square in bold in the diagram showing ‘in total’ represents two patients