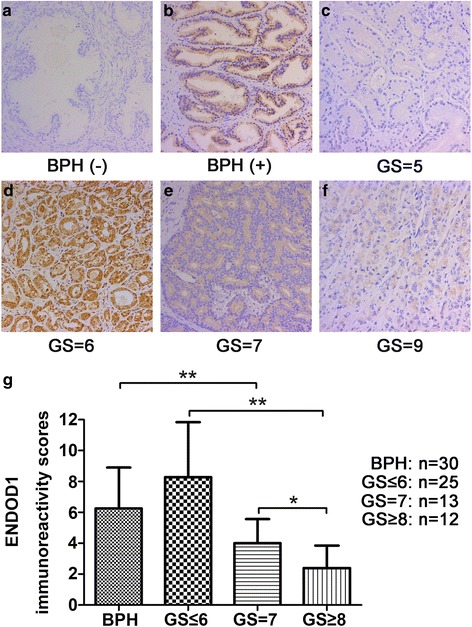
Fig. 1.

ENDOD1 is downregulated in PCa tissues with high Gleason scores. a-f Representative images showed the ENDOD1 immunostaining intensity. BPH tissues showed negative (a) and moderate (b) ENDOD1 staining. PCa tissues showed negative (c), strong (d), and moderate (e) and weak (f) ENDOD1 staining, respectively. Magnification 200×. g, Immunoreactivity scores (IRS) analysis of ENDOD1 in BPH tissues and PCa tissues. IRS were determined by multiplying the level of staining intensity (negative = 0, weak = 1, moderate = 2, strong = 3) and percentage of positively stained cells (0% = 0, <10% = 1, 11–50% = 2, 51–80% = 3, >80% = 4). Results indicated that PCa tissues with higher Gleason scores (Gleason score ≥ 7) showed significantly lower ENDOD1 expression than that with low Gleason score and BPH tissues. *P<0.05; **P<0.01
