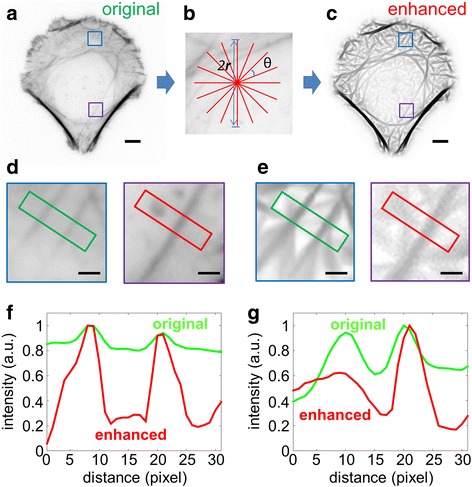
Fig. 2.

Anisotropic image enhancement. a, c Images of U2OS cell plated on crossbow-shaped micropattern before (A) and after (C) image enhancement by LFT and OFT (B). Blue box: a region containing two parallel filaments of low contrast with background. Purple box: an area containing a cluster-like noise and a filamentous structure. b An illustrative enhancement filter with a total length of 2r and a stepwise rotation angle of θ. Scale bar, 5 μm. d, e Enlarged images of blue and purple boxes in (A) and (B) respectively. Scale bar, 1 μm. f Normalized intensity profiles of the green-cropped regions (D, E, left) the blue square boxes from (A) and (B). g Normalized intensity profiles of the red-cropped regions (D, E, right) in the purple square boxes from (A) and (B).
