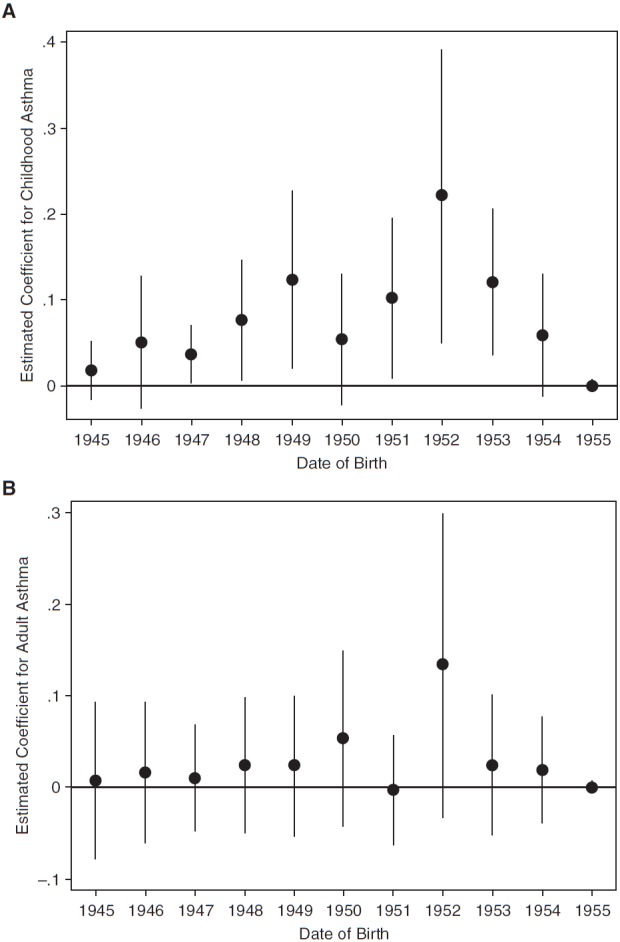
Figure 3.

Coefficient estimates for childhood (A) and adult (B) asthma. Dots represent the regression-estimated coefficients on the interaction term between year of birth and whether the respondent was born in London. Regressions include controls for sex and age 10 residence characteristics. Error bars indicate 95% confidence intervals based on SEs clustered by born in London status and month of birth.
