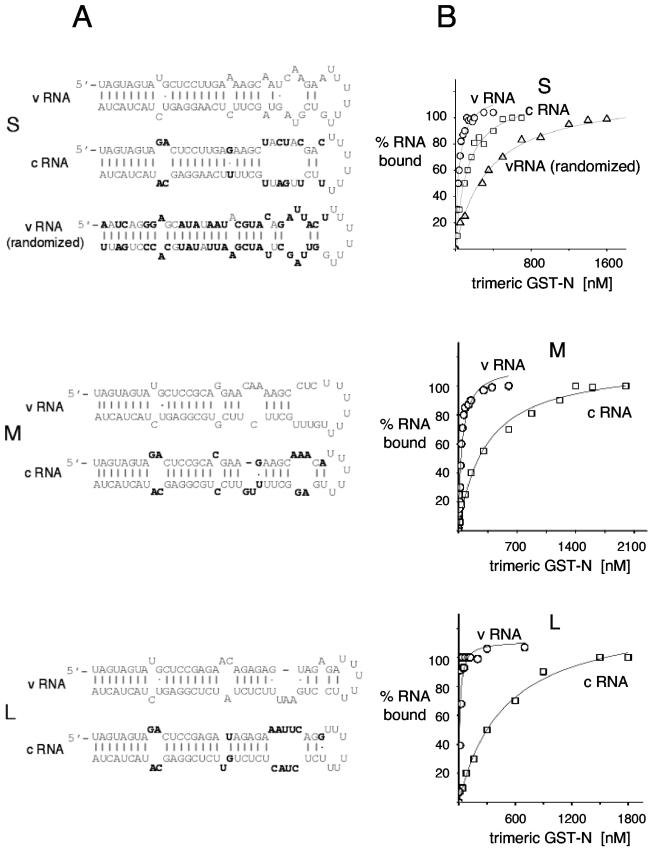
FIG.1.
RNA binding profile of trimeric GST-N with the viral and complementary panhandles corresponding to the S, M, and L segments. (A) The nucleotide sequence and highly probable secondary structure of each of the RNAs is shown at the left. For each of the panhandle sequences, the nucleotides common to the both the complementary RNA (cRNA) and its antecedent viral RNA (vRNA) are shown in grey, while the nucleotides of the complementary RNA that vary relative to the viral RNA are shown in black. To generate viral RNA (randomized), the 5′ nucleotides of the S segment RNA were randomized and the 3′ nucleotides were chosen such that the secondary structure of the RNA would be the same as that of the viral RNA panhandle. Nucleotides that vary relative to those of the viral RNA panhandle are shown in black. (B) The RNA binding profiles as a function of increasing purified trimeric GST-N are shown in the right part of the figure. Increasing concentrations of purified trimeric GST-N were incubated with a constant concentration of 32P-labeled RNA and protein-RNA complexes were isolated by filter binding as described in the Materials and Methods section. The data are plotted to show the binding profile at relatively high concentrations of trimeric GST-N and at 80 mM salt to display binding to complementary RNA and viral RNA (randomized). To determine the dissociation constants for the viral RNAs, the data were replotted to optimize visualization and analysis at lower trimeric GST-N concentrations. The data shown are from one experiment. However, each of the RNAs was analyzed in three separate experiments, and the measured Kds with standard deviations are shown in Table 1.

