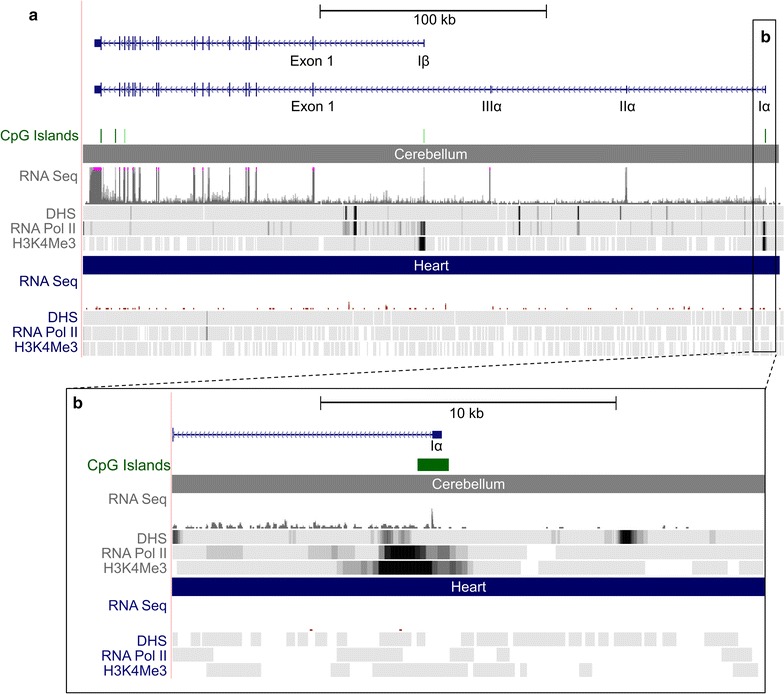
Fig. 1.

Atp2b2 genomic region adapted from the UCSC genome browser. Image exported from UCSC genome browser (NCBI37/mm9), data is from the Encyclopedia of DNA elements (ENCODE) consortium [22, 23]. Atp2b2 transcripts are shown in blue. a The whole genomic region surrounding Atp2b2 is shown. Marks for transcriptional modulation are shown in 8 week mouse cerebellum vs 8 week mouse heart tissue. The RNA-Sequencing (RNA-Seq) data suggests that both the α and β transcripts of Atp2b2 are expressed in the cerebellum. Neither transcript appears to be expressed in the heart. Both the α and β transcripts of Atp2b2 have a CpG island at their TSSs. Markers of active transcription (DHS, RNA Pol II and H3K4me3) are present in the cerebellum (shown as a heat map) but are not present in the heart. b The region surrounding the αAtp2b2 TSS is enlarged to show detail [23]
