Fig. 5.

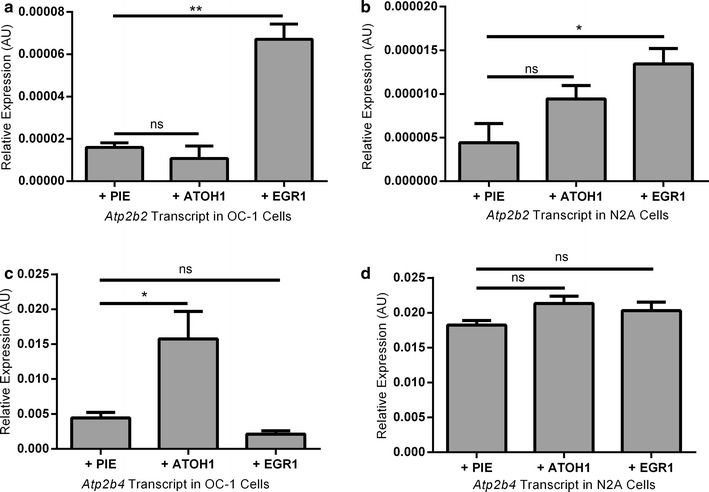
Effect of overexpression of Atoh1 and Egr1 on endogenous levels of Atp2b2 and Atp2b4. a, b EGR1 increases expression of Atp2b2 in both OC-1 and N2A cell lines. ATOH1 moderately inhibits expression of Atp2b2 in OC-1 (ns) and has no effect in N2A cells. c, d Atp2b4 transcript expression is unaffected by overexpression of EGR1 in both OC-1 and N2A cells. ATOH1 increases expression of Atp2b4 transcript in OC-1 cells but not in N2A cells. Comparisons to empty vector (PIE) were made using a Student’s t test (*P ≤ 0.05, **P ≤ 0.01). Data shown is the average of three technical replicates for three biological replicates in each cell line, variation is shown as standard error of the mean
