
Fig. 1.
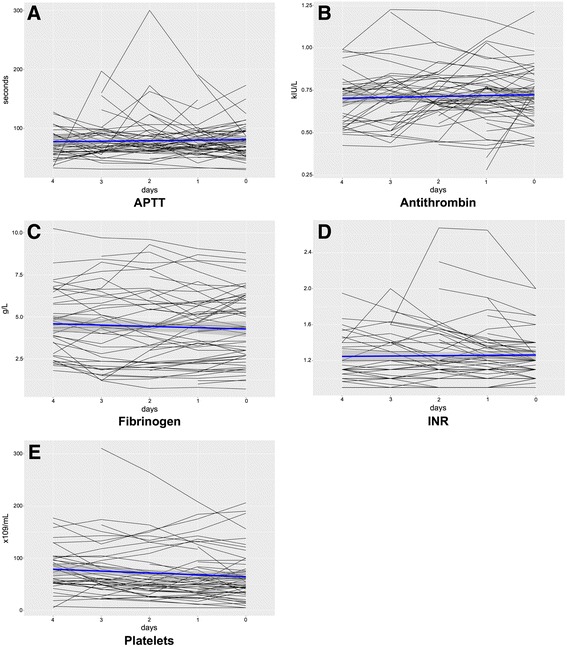
ICH cohort: temporal trajectories for coagulation variables prior to ICH diagnosis. Calculated using the daily means in the 4 days preceding the diagnosis of an ICH as well as on the day of ICH diagnosis. The horizontal axis indicates the amount of days prior to detection of an ICH, where “0” is the same day that the ICH was later detected. The horizontal blue lines represent the combined daily mean values for all patients, and the gray area represents the corresponding 95% confidence interval. APTT activated partial thromboplastin time, INR international normalized ratio