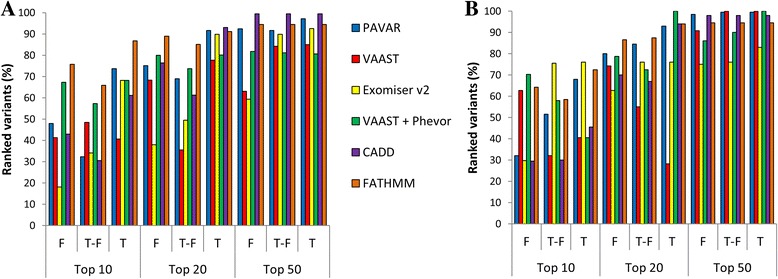
Fig. 3.

Benchmarking analyses for PAVAR (blue), VAAST (red), Exomiser v2 (yellow), VAAST-Phevor (green), CADD (purple), and FATHMM (orange). Bar charts show the percentage of hearing loss (a) and CNM (b) variants ranked by each strategy among the top 10, 20, or 50, after filtering by each control dataset filter. F = family controls exome dataset, T-F = in-house control data exome dataset without family control datasets, and T = in-house and family control datasets
