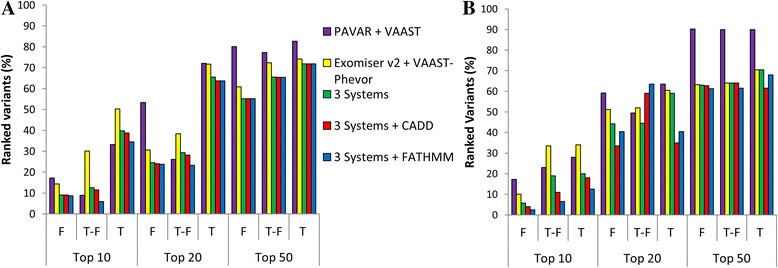
Fig. 4.

Benchmarking analyses combining prioritizing strategies. Bar charts show the percentage of shared variants for hearing loss (a) and CNM (b), ranked by PAVAR + VAAST (purple), Exomiser v2 + (VAAST-Phevor) (yellow), the three systems (green) the three systems and CADD (red), and the three systems and FATHMM (blue) among the top 10, 20, or 50, after filtering by different control datasets. F = family controls exome dataset, T-F = in-house control data exome dataset without family control dataset, and T = in-house and family control datasets
