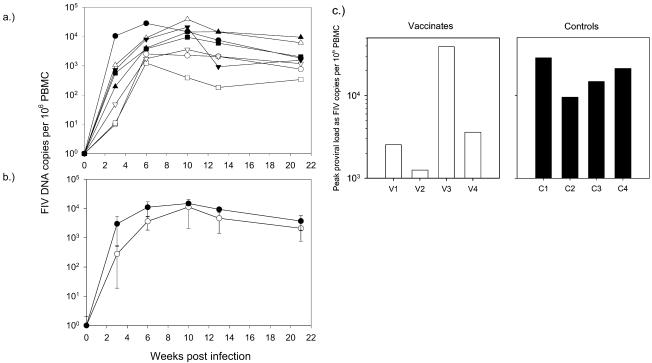
FIG. 2.
Proviral loads in vaccinated (open symbols) and control (filled symbols) cats measured at intervals postchallenge by real-time PCR. (a) Proviral loads of the individual cats (values for V3 are represented by triangles); (b) mean loads ± standard errors of the means for the vaccinates (○) and the controls (•); (c) peak proviral loads in PBMC from vaccinated (□) and control (▪) cats.

