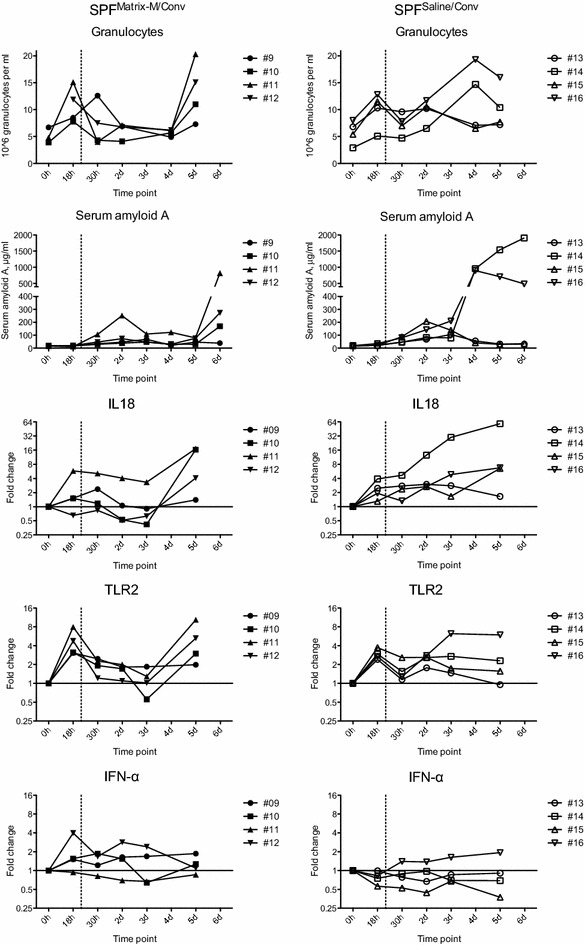
Figure 5.

Granulocyte counts, SAA and gene expression in blood of SPF pigs administered Matrix-M or saline. The pigs were administered Matrix-M or saline (0 h), transport to the animal facility (arrival at 18 h) and exposed to conventional pigs (at 22 h, dashed vertical line). Individual FC values are presented for SPFMatrix/Conv pigs (closed symbols) and SPFSaline/Conv pigs (open symbols). FC is calculated against the 0 h time point for each individual.
