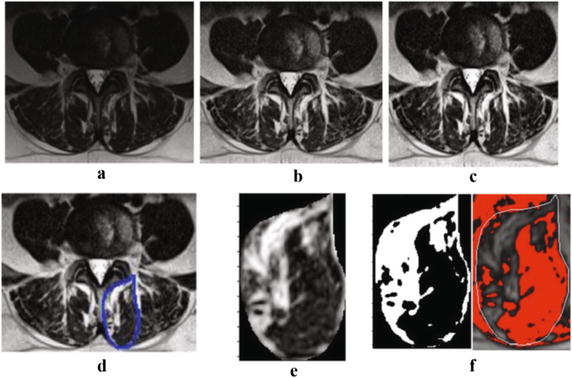
Fig. 1.

A sample MRI image at L4–L5 and the processed image after each step of the algorithm; a the original MRI image, b adaptive equalized algorithm image, c adjusted contrast image, d the select area, e the cropped area of the selected ROI, f the resulted binary image from automated algorithm (left) and manual thresholding technique (right)
