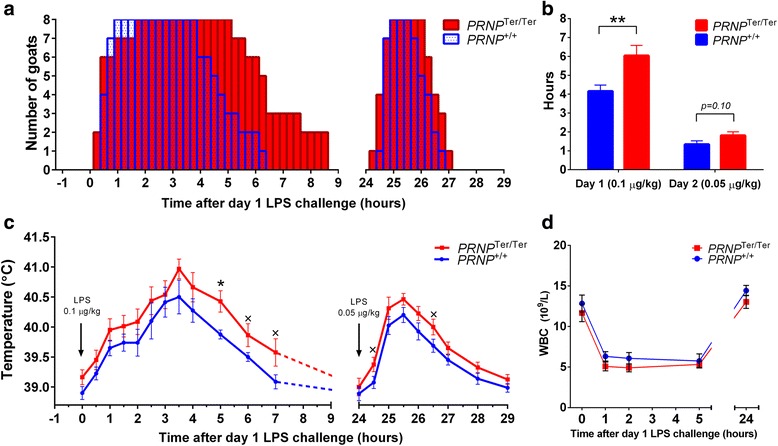
Fig. 1.

Sickness behavior, rectal temperature, and white blood cells after LPS challenge. Goats were suspected to a dual LPS challenge; 0.1 and 0.05 μg/kg. The diagrams show the number of goats displaying sickness behavior at the indicated time points (a) and the mean duration of sickness behavior after LPS challenge (b). The rectal temperature (c) and total number of white blood cells (d) are shown at the indicated time points after LPS challenge. Values are mean ± SEM, n = 16. **p < 0.01; *p < 0.05; × p < 0.1 (trend)
