Fig. 1.

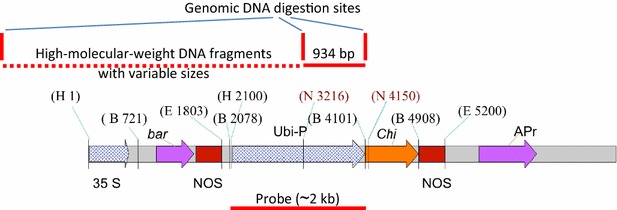
Restriction map of the plant expression vector pBarley/chi/bar. H, HindIII; B, BamHI; E, EcoRI; N, NcoI. Sites of probe and genomic DNA digestions are indicated by red solid and/or dotted lines

Restriction map of the plant expression vector pBarley/chi/bar. H, HindIII; B, BamHI; E, EcoRI; N, NcoI. Sites of probe and genomic DNA digestions are indicated by red solid and/or dotted lines