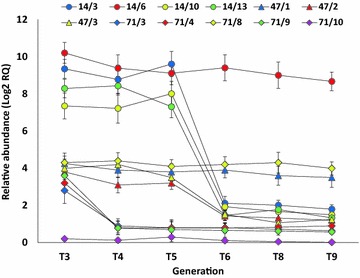
Fig. 5.

qRT-PCR analysis of relative transcript abundance of chi26 transgene in T3–T9 transgenic wheat families (CHI 14/3, CHI 14/6, CHI 14/10, CHI 14/13, CHI 47/1, CHI 47/2, CHI 47/3, CHI 71/3, CHI 71/4, CHI 71/8, CHI 71/9 and CHI 71/10) belonging to three transgenic lines CHI 14 (filled circles), CHI 47 (filled triangles) and CHI 71 (filled diamonds). Data were statistically analyzed and multiple comparisons were made following Duncan’s multiple range test [28]
