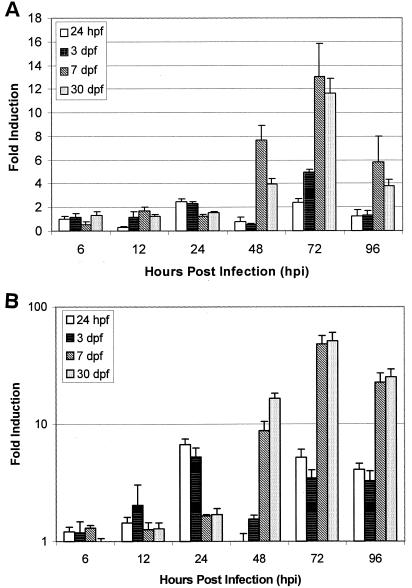
FIG. 6.
Quantitative real-time PCR analysis of zebrafish IFN (A) and Mx (B) mRNA expression after immersion for 5 h in 106 TCID50 of SHRV/ml. Zebrafish were exposed at 24 hpf and at 3, 7, and 30 dpf. Total RNA was extracted from selected samples through 96 hpi. The data are representative of three independent exposures. Each bar represents the mean fold induction of SHRV-infected samples over corresponding controls. Expression values were normalized to zebrafish β-actin.

