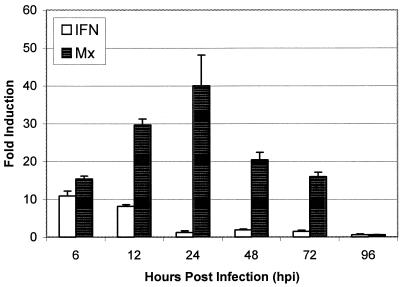
FIG. 7.
Quantitative real-time PCR analysis of zebrafish IFN and Mx mRNA expression in the livers of adult fish injected i.p. with 105 TCID50 of SHRV/ml. The data are representative of three independent exposures. Each bar represents the mean fold induction of SHRV-infected samples over corresponding controls. Expression values were normalized to zebrafish β-actin.

