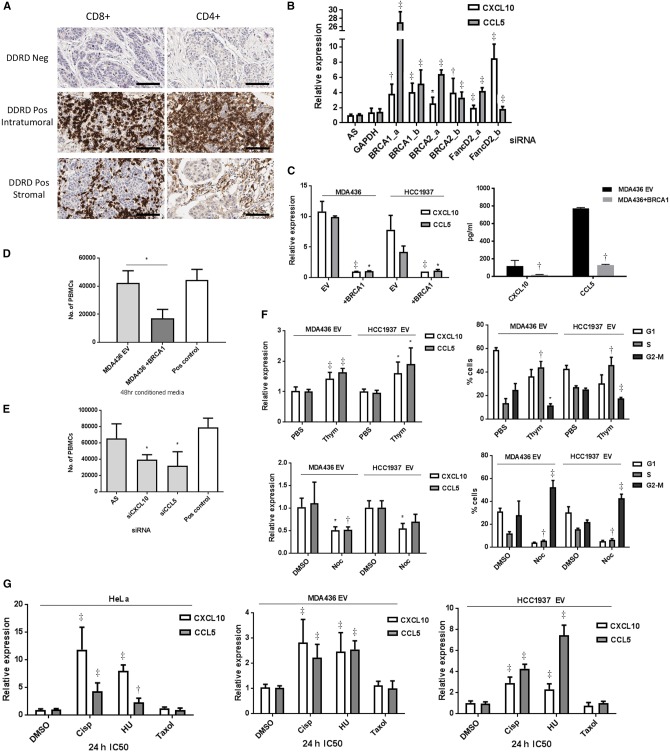
Figure 1.
Immune gene expression in FA/BRCA DNA repair pathway loss. A) Immunohistochemistry (IHC) images (x40) showing absence of CD8+ and CD4+ lymphocytes in DDRD assay–negative tumors, and both intratumoral and stromal CD8+ and CD4+ lymphocytes in DDRD assay–positive breast tumors. Scale bar represents 100 µm. B) Quantitative polymerase chain reaction (qPCR) measurement of CCL5 and CXCL10 chemokine mRNA expression following knockdown of BRCA1, BRCA2, and FANCD2 in HeLa cells using two independent siRNAs (a and b) compared with control siRNA (AS). GAPDH siRNA has also been used as a negative control. C) qPCR measurement (left panel) of CCL5 and CXCL10 chemokine mRNA expression in MDA-MB-436-EV and HCC1937-EV BRCA1-mutant cell lines compared with BRCA1-corrected MDA-MB-436 and HCC1937-BRCA1 cell lines. CXCL10 and CCL5 quantification by enzyme-linked immunosorbent assay (ELISA) of media collected from MDA-MB-436 BRCA1 and empty vector counterparts (EV) are shown in the right panel. D) Migration of activated peripheral blood mononuclear cells (PBMCs) toward conditioned media from MDA-MB-436-EV compared with MDA-MB-436-BRCA1 using a Boyden Invasion Chamber Assay. E) Migration of activated PBMCs toward conditioned media from MDA-MB-436-EV cells treated with CXCL10 and CCL5 siRNA compared with nontargeting siRNA control (AS) using a Boyden invasion chamber assay. See also Supplementary Figure 1, C and D (available online). F) qPCR measurement of CXCL10 and CCL5 mRNA in MDA-MB-436-EV and HCC1937-EV cells arrested in S-phase using double-thymidine block (2.5 mM) (top left panel) and M-phase using nocodazole (100 ng/mL) (bottom left panel). Cell cycle analysis following double-thymidine treatment as compared with phosphate-buffered saline (PBS) control is shown in the top right panel, and nocodazole-treated cells as compared with DMSO control in the bottom right panel. G) qPCR measurement of CXCL10 and CCL5 mRNA expression in HeLa (left panel), MDA-MB-436-EV (center panel), and HCC1937-EV (right panel) cells 24 hours following treatment with cisplatin, HU, or paclitaxel at IC50 concentration for each cell line, and the data was normalized to PUM1 expression. Data are represented as mean ± SD, and P values were calculated using the unpaired, two-tailed Student’s t test. *P < .05, †P < .01, ‡P < .001. DDRD = DNA damage response–deficient; PBMC = peripheral blood mononuclear cell; PBS = phosphate-buffered saline.

