Figure 3.
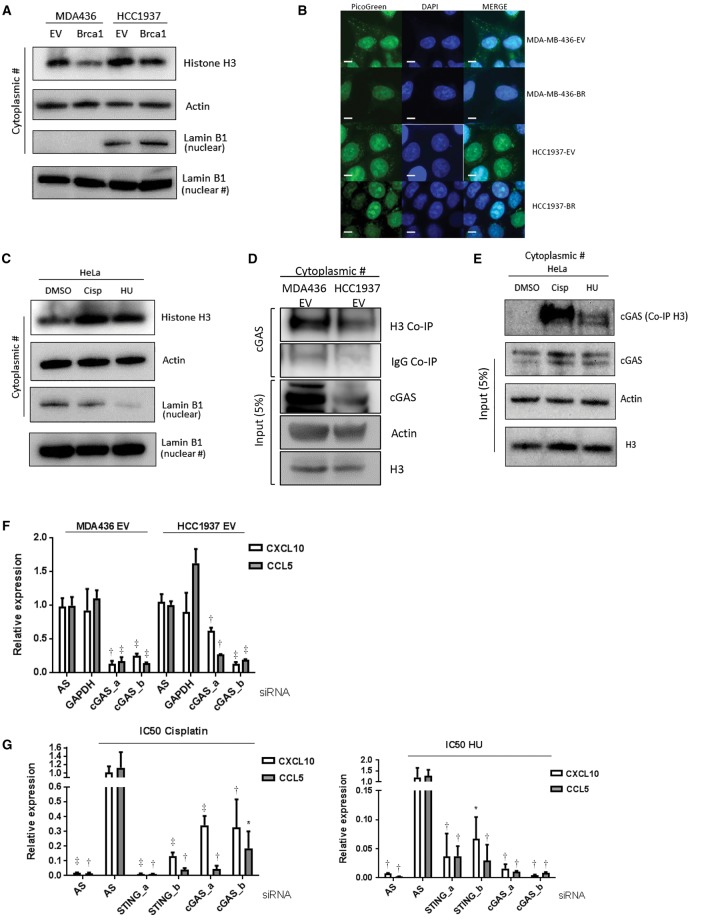
Analysis of cytosolic DNA in DNA damage response deficiency. A) Immunoblot for Histone H3 in the cytosolic fraction of DNA damage repair–deficient cell lines (MDA-MB-436-EV and HCC1937-EV) compared with isogenic BRCA1–corrected cells (MDA-MB-436-BRCA1 and HCC1937-BRCA1). Actin is included as a loading control. Nuclear Lamin B1 shows degree of fractionation achieved. Densitometry has been performed on Histone H3 expression in Supplementary Figure 3B (available online). B) PicoGreen staining of MDA-MB-436 and HCC1937 BRCA1-complemented and empty vector counterparts. Scale bar represents 10 µm. C) Immunoblot for Histone H3 in the cytosolic of HeLa cells treated with IC50 dose cisplatin (1.46 µM) and hydroxyurea (326 µM) compared with a DMSO control. Actin and Lamin B1 are included as loading controls. Densitometry has been performed on Histone H3 expression in Supplementary Figure 3B (available online). D) Immunoblot for cGAS using Histone H3 immunoprecipitate from the cytoplasmic fraction of MDA-MB-436-EV and HCC1937-EV cells. Total cGAS, Histone H3 input, and Actin loading controls are shown. E) Immunoblot for cGAS using Histone H3 immunoprecipitate from the cytoplasmic fraction of HeLa cells treated with cisplatin and HU compared with DMSO control. Total cGAS, Histone H3 input, and Actin loading controls are shown. F) Quantitative polymerase chain reaction (qPCR) measurement of CXCL10 and CCL5 mRNA expression in MDA-MB-436-EV and HCC1937-EV cells using two independent siRNAs targeting cGAS (a and b), compared with nontargeting siRNA control (AS). G) qPCR measurement of CXCL10 and CCL5 mRNA 48 hours after IC50 dose cisplatin (1.46 µM) (left panel) and hydroxyurea (326 µM) (right panel treatment in HeLa cells). cGAS expression was knocked down 24 hours prior to drug treatment using two independent siRNAs targeting cGAS (a and b). A nontargeting siRNA control (AS) is included. All data are representative of mean ± SD, and P values were calculated using the unpaired, two-tailed Student’s t test. *P < .05, †P < .01, ‡P < .001.

