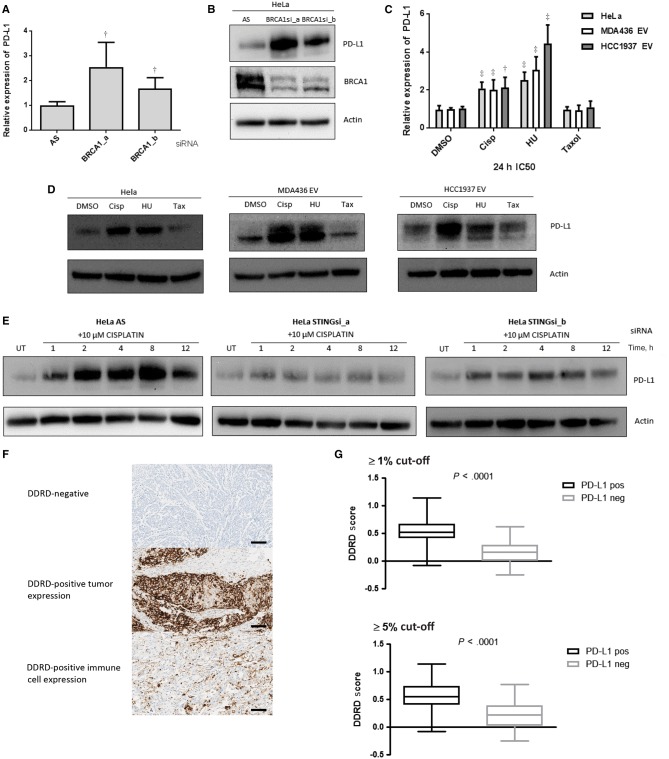
Figure 4.
PD-L1 expression in DNA damage response deficiency. A) Quantitative polymerase chain reaction (qPCR) measurement of PD-L1 expression in HeLa cells using two independent siRNAs targeting BRCA1 (a and b), compared with nontargeting siRNA control (AS). B) Immunoblot of PD-L1 and BRCA1 protein expression in HeLa cells following two independent siRNAs targeting BRCA1 (a and b). Actin is shown as a loading control. C) qPCR measurement of PD-L1 mRNA expression in HeLa, MDA-MB-436-EV, and HCC1937-EV cells 24 hours following treatment with cisplatin, HU, and paclitaxel at the IC50 dose appropriate for each cell line. All data are representative of mean ± SD, and P values were calculated using the unpaired, two-tailed Student’s t test. *P < .05, †P < .01, ‡P < .001. D) Immunoblot for PD-L1 protein expression in HeLa, MDA-MB-436-EV, and HCC1937-EV cells 24 hours following treatment with IC50 doses of cisplatin, HU, and paclitaxel. Actin is included as a loading control. E) Immunoblot for PD-L1 in HeLa cells after siRNA-mediated knockdown of STING using two independent siRNAs (a and b) from one to 12 hours following cisplatin treatment (10 µM). A nontargeting siRNA control (AS) is included. Actin is included as a loading control. F) Immunohistochemistry (IHC) images (x20) representing immunostaining for PD-L1 in no staining (upper panel), epithelial staining (middle panel), and immune staining (lower panel). Scale bar represents 100 µm. G) Boxplot graph showing relationship between DDRD assay score and PD-L1 expression as assessed by IHC at ≥ 1% (upper panel) and ≥5% (lower panel) cut-offs. DDRD = DNA damage response–deficient.

