Figure 3.

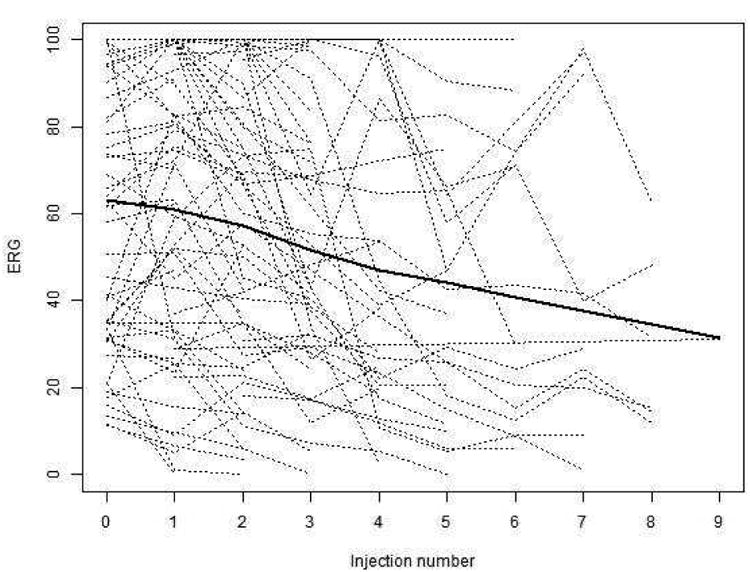
Individual patient trajectories of ERG over time, as measured by number of injections, (dotted lines) with a LOWESS smooth depicting the overall trend (solid line).

Individual patient trajectories of ERG over time, as measured by number of injections, (dotted lines) with a LOWESS smooth depicting the overall trend (solid line).